Copyright
©The Author(s) 2015.
World J Gastroenterol. Nov 7, 2015; 21(41): 11597-11608
Published online Nov 7, 2015. doi: 10.3748/wjg.v21.i41.11597
Published online Nov 7, 2015. doi: 10.3748/wjg.v21.i41.11597
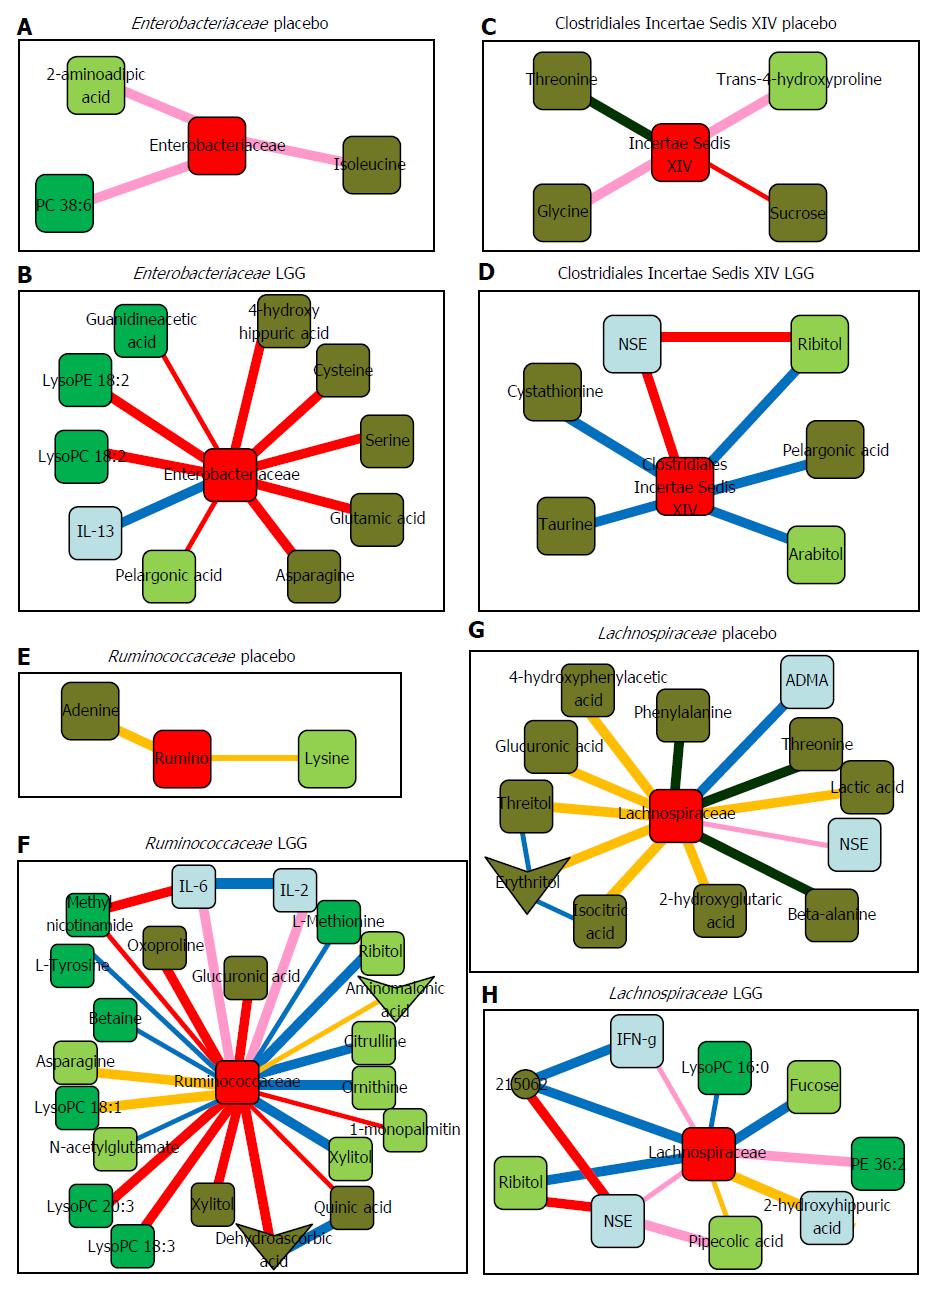
Figure 2 Sub-networks showing correlation network differences from baseline to week 8 in placebo and in Lactobacillus GG groups separately centered on selected bacterial taxa.
Color of nodes: Blue, inflammatory cytokine; light green, serum metabolites; dark green, urine metabolites. Color of edges: pink, negative remained negative but there is a net loss of negative correlation; dark blue, negative changed to positive; yellow, positive remained positive but there is a net loss of positive correlation; red, positive to negative; dark green, complete shift of negative to positive; military green, complete shift of positive to negative. A, B: Sub-networks of correlation changes centered around Enterobacteriaceae; C, D: Sub-networks of correlation changes centered around Clostridiales Incertae Sedis XIV; E, F: Sub-networks of correlation changes centered around Ruminococcaceae; G, H: Sub-networks of correlation changes centered around Lachnospiraceae. NSE: Neuron-specific enolase; IL: Interleukin; IFN: Interferon; LysoPC: Lysophosphatidylcholine; LysoPE: Lysophosphatidylethanolamine; ADMA: Asymmetricdimethylarginine; Rumino: Ruminococcaceae. Data adapted from Bajaj et al[69].
- Citation: Usami M, Miyoshi M, Yamashita H. Gut microbiota and host metabolism in liver cirrhosis. World J Gastroenterol 2015; 21(41): 11597-11608
- URL: https://www.wjgnet.com/1007-9327/full/v21/i41/11597.htm
- DOI: https://dx.doi.org/10.3748/wjg.v21.i41.11597


