Copyright
©2014 Baishideng Publishing Group Inc.
World J Gastroenterol. Nov 21, 2014; 20(43): 16227-16235
Published online Nov 21, 2014. doi: 10.3748/wjg.v20.i43.16227
Published online Nov 21, 2014. doi: 10.3748/wjg.v20.i43.16227
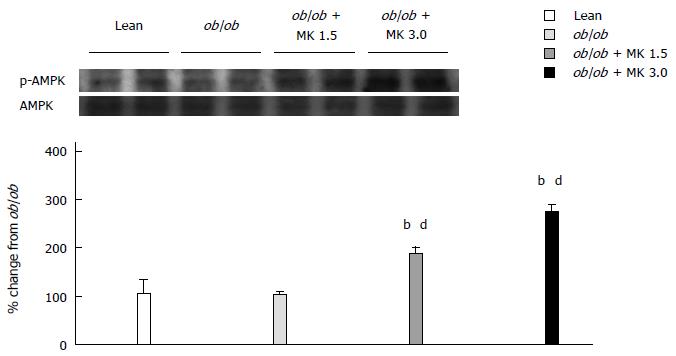
Figure 4 Phosphorylation of AMP-activated protein kinase following MK-0626 treatment in whole livers from each experimental group.
The groups are the same as those shown in Figure 1. A representative western blot shows phosphorylation of AMP-activated protein kinase (AMPK) at the end of the 8-wk treatment period. The histogram below shows the expression of p-AMPK normalized to AMPK. Results are expressed as the mean ± SD; n = 16 for each group. bP < 0.01 vs the lean group; dP < 0.01 vs the ob/ob group.
-
Citation: Ohyama T, Sato K, Yamazaki Y, Hashizume H, Horiguchi N, Kakizaki S, Mori M, Kusano M, Yamada M. MK-0626, a selective DPP-4 inhibitor, attenuates hepatic steatosis in
ob/ob mice. World J Gastroenterol 2014; 20(43): 16227-16235 - URL: https://www.wjgnet.com/1007-9327/full/v20/i43/16227.htm
- DOI: https://dx.doi.org/10.3748/wjg.v20.i43.16227


