Copyright
©2014 Baishideng Publishing Group Inc.
World J Gastroenterol. Nov 21, 2014; 20(43): 16227-16235
Published online Nov 21, 2014. doi: 10.3748/wjg.v20.i43.16227
Published online Nov 21, 2014. doi: 10.3748/wjg.v20.i43.16227
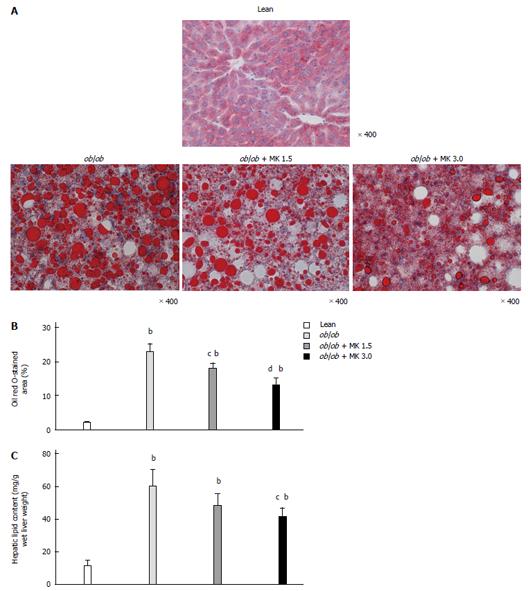
Figure 2 Assessment of hepatic histology and lipid content in the livers of ob/ob mice and their lean littermates at the end of an 8-wk treatment period.
The groups are the same as those shown in Figure 1; A: Representative hepatic histology of lean, ob/ob, ob/ob + MK 1.5 and ob/ob + MK 3.0 groups. Liver sections were stained with Oil red O; B: Quantitative histomorphometric analysis for total lipid content of all hepatic histology for each experimental group. Oil red O-stained areas were quantified in 10 microscopic fields at a 400-fold magnification; C: Quantification of the lipid content of the liver from each experimental group. Results are expressed as the mean ± SD; n =16 for each group. bP < 0.01 vs the lean group; cP < 0.05, dP < 0.01 vs the ob/ob group.
-
Citation: Ohyama T, Sato K, Yamazaki Y, Hashizume H, Horiguchi N, Kakizaki S, Mori M, Kusano M, Yamada M. MK-0626, a selective DPP-4 inhibitor, attenuates hepatic steatosis in
ob/ob mice. World J Gastroenterol 2014; 20(43): 16227-16235 - URL: https://www.wjgnet.com/1007-9327/full/v20/i43/16227.htm
- DOI: https://dx.doi.org/10.3748/wjg.v20.i43.16227


