Copyright
©2014 Baishideng Publishing Group Co.
World J Gastroenterol. Jan 28, 2014; 20(4): 1095-1106
Published online Jan 28, 2014. doi: 10.3748/wjg.v20.i4.1095
Published online Jan 28, 2014. doi: 10.3748/wjg.v20.i4.1095
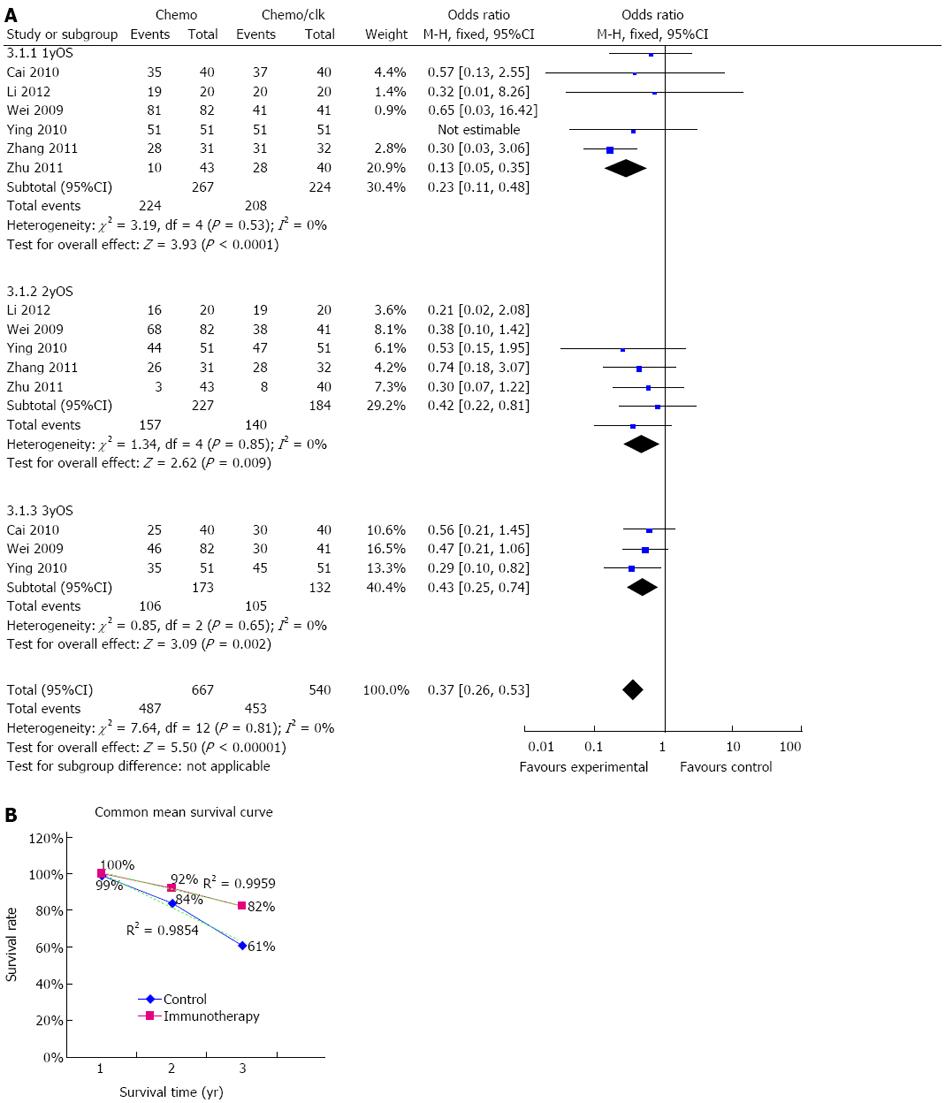
Figure 2 Overall survival.
A: Comparison of 1-, 2- and 3-year overall survival (OS) between the chemo-dendritic cell-cytokine-induced killer cells and chemo-alone groups. The fixed-effects meta-analysis model (Mantel-Haenszel method) was used. Each trial is represented by a square, the center of which gives the odds ratio for that trial. The size of the square is proportional to the information in that trial. The ends of the horizontal bars denote a 95%CI. The black diamond gives the overall odds ratio for the combined results of all trials; B: Mean survival including two trials (Wei et al[22] and Ying et al[23]) with excel line graph. The dotted line represents the trend line of each group.
- Citation: Wang ZX, Cao JX, Liu ZP, Cui YX, Li CY, Li D, Zhang XY, Liu JL, Li JL. Combination of chemotherapy and immunotherapy for colon cancer in China: A meta-analysis. World J Gastroenterol 2014; 20(4): 1095-1106
- URL: https://www.wjgnet.com/1007-9327/full/v20/i4/1095.htm
- DOI: https://dx.doi.org/10.3748/wjg.v20.i4.1095


