Copyright
©2014 Baishideng Publishing Group Inc.
World J Gastroenterol. Oct 14, 2014; 20(38): 14051-14057
Published online Oct 14, 2014. doi: 10.3748/wjg.v20.i38.14051
Published online Oct 14, 2014. doi: 10.3748/wjg.v20.i38.14051
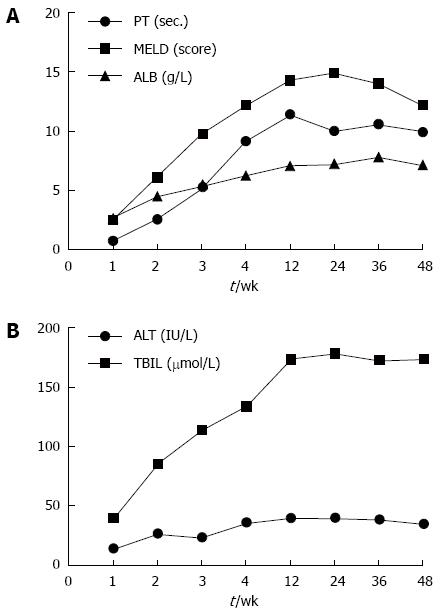
Figure 2 Mean relative changes from baseline of liver function and model for end-stage liver disease scores during 48 wk follow-up.
A: The change-trend of model for end-stage liver disease (MELD) scores, and prothrombin times (PT) and abnormal serum albumin (ALB) levels; B: The change-trend of alanine aminotransferase (ALT) and total bilirubin (TBIL) levels (Data were from Peng et al[19]).
- Citation: Pan XN, Zheng LQ, Lai XH. Bone marrow-derived mesenchymal stem cell therapy for decompensated liver cirrhosis: A meta-analysis. World J Gastroenterol 2014; 20(38): 14051-14057
- URL: https://www.wjgnet.com/1007-9327/full/v20/i38/14051.htm
- DOI: https://dx.doi.org/10.3748/wjg.v20.i38.14051


