Copyright
©2014 Baishideng Publishing Group Inc.
World J Gastroenterol. Sep 14, 2014; 20(34): 12202-12211
Published online Sep 14, 2014. doi: 10.3748/wjg.v20.i34.12202
Published online Sep 14, 2014. doi: 10.3748/wjg.v20.i34.12202
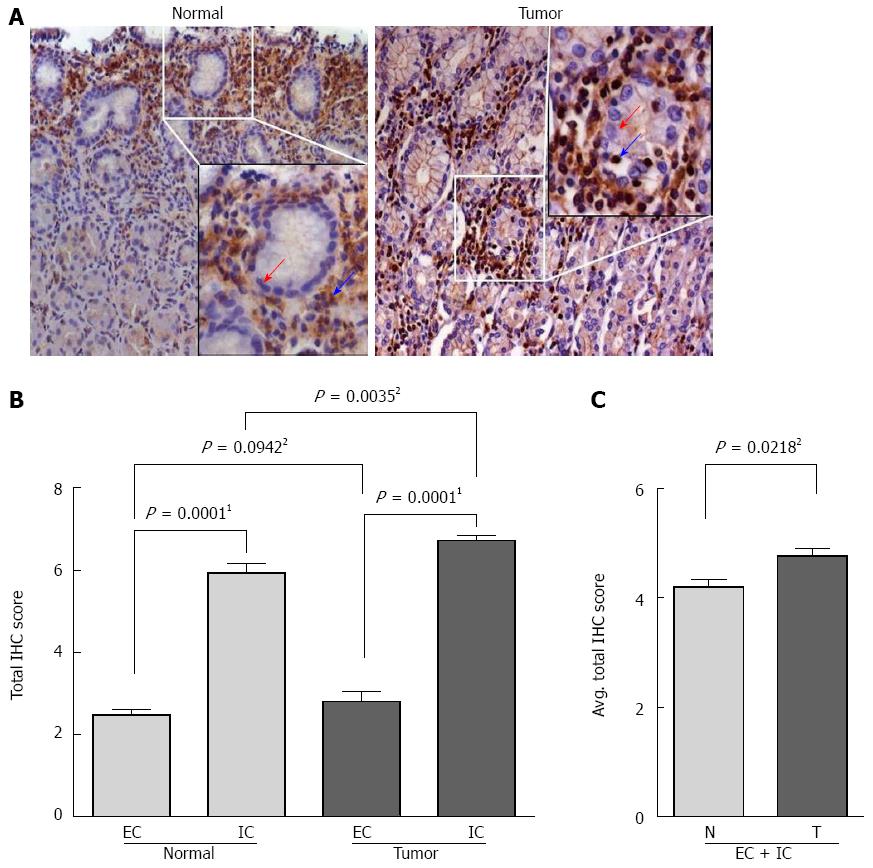
Figure 2 Histological analysis of β-actin in gastric normal and tumor tissues (n = 24).
“Total IHC score” and “Average total IHC score” were calculated as described in Table 1. A: Representative pictures of β-actin immuno-staining of normal (left panel) and tumor (right panel) tissues showed β-actin expression is majorly distributed between epithelial (red arrow) and inflammatory (blue arrow) cells. The image is taken at 20 × magnification; B: “Total IHC score” of EC and IC of normal (N) and tumor (T) tissues were plotted; C: “Average total IHC score” for normal and tumor tissues were plotted. 1Mann-Whitney test; 2Wilcoxon matched pair test. IHC: Immunohistochemistry; EC: Epithelial cells; IC: Inflammatory cells.
- Citation: Khan SA, Tyagi M, Sharma AK, Barreto SG, Sirohi B, Ramadwar M, Shrikhande SV, Gupta S. Cell-type specificity of β-actin expression and its clinicopathological correlation in gastric adenocarcinoma. World J Gastroenterol 2014; 20(34): 12202-12211
- URL: https://www.wjgnet.com/1007-9327/full/v20/i34/12202.htm
- DOI: https://dx.doi.org/10.3748/wjg.v20.i34.12202


