Copyright
©2014 Baishideng Publishing Group Inc.
World J Gastroenterol. Aug 14, 2014; 20(30): 10512-10517
Published online Aug 14, 2014. doi: 10.3748/wjg.v20.i30.10512
Published online Aug 14, 2014. doi: 10.3748/wjg.v20.i30.10512
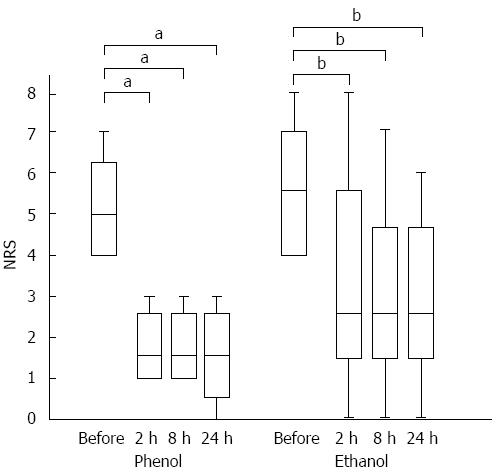
Figure 2 Time to the onset of pain relief in each group.
A box-plot of pre- and post-endoscopic ultrasound-guided celiac plexus neurolysis pain scores. The first and third quartiles are represented by the ends of the box, the median is indicated by the horizontal line in the interior of the box, and the maximum and minimum values are at the ends of the whiskers. In each group, the pain score was decreased at 2 h after the procedure. The statistical analysis is based on the Wilcoxon signed-rank test. NRS: Numeric Rating Scale. aP < 0.05 vs control; bP < 0.01 vs control.
- Citation: Ishiwatari H, Hayashi T, Yoshida M, Ono M, Masuko H, Sato T, Miyanishi K, Sato Y, Takimoto R, Kobune M, Miyamoto A, Sonoda T, Kato J. Phenol-based endoscopic ultrasound-guided celiac plexus neurolysis for East Asian alcohol-intolerant upper gastrointestinal cancer patients: A pilot study. World J Gastroenterol 2014; 20(30): 10512-10517
- URL: https://www.wjgnet.com/1007-9327/full/v20/i30/10512.htm
- DOI: https://dx.doi.org/10.3748/wjg.v20.i30.10512


