Copyright
©2014 Baishideng Publishing Group Inc.
World J Gastroenterol. Jun 21, 2014; 20(23): 7392-7402
Published online Jun 21, 2014. doi: 10.3748/wjg.v20.i23.7392
Published online Jun 21, 2014. doi: 10.3748/wjg.v20.i23.7392
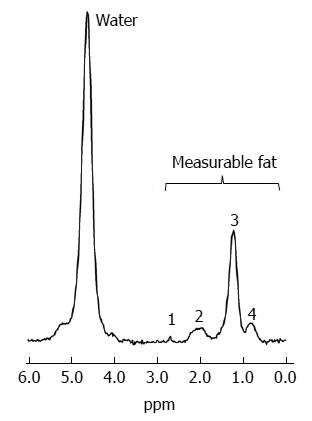
Figure 3 Magnetic resonance spectroscopy spectrum of hepatic fat.
Water and fat peaks are displayed at different frequencies; water appears as a single peak at 4.7 ppm, whereas fat appears as four peaks, including the dominant methylene (CH2) peak at 1.3 ppm (3), a methyl (CH3) peat at 0.9 ppm (4), an α-olefinic and α-carboxyl peak at 2.1 ppm (2), and a diacyl peak at 2.75 ppm (1); the areas of these four fat peaks and the water peak can be measured by spectral tracing. Proton density fat fraction can be calculated as (sum of fat peaks) ÷ (sum of fat peaks + water peak)[45,82].
- Citation: Lee SS, Park SH. Radiologic evaluation of nonalcoholic fatty liver disease. World J Gastroenterol 2014; 20(23): 7392-7402
- URL: https://www.wjgnet.com/1007-9327/full/v20/i23/7392.htm
- DOI: https://dx.doi.org/10.3748/wjg.v20.i23.7392


