Copyright
©2014 Baishideng Publishing Group Inc.
World J Gastroenterol. May 28, 2014; 20(20): 6055-6072
Published online May 28, 2014. doi: 10.3748/wjg.v20.i20.6055
Published online May 28, 2014. doi: 10.3748/wjg.v20.i20.6055
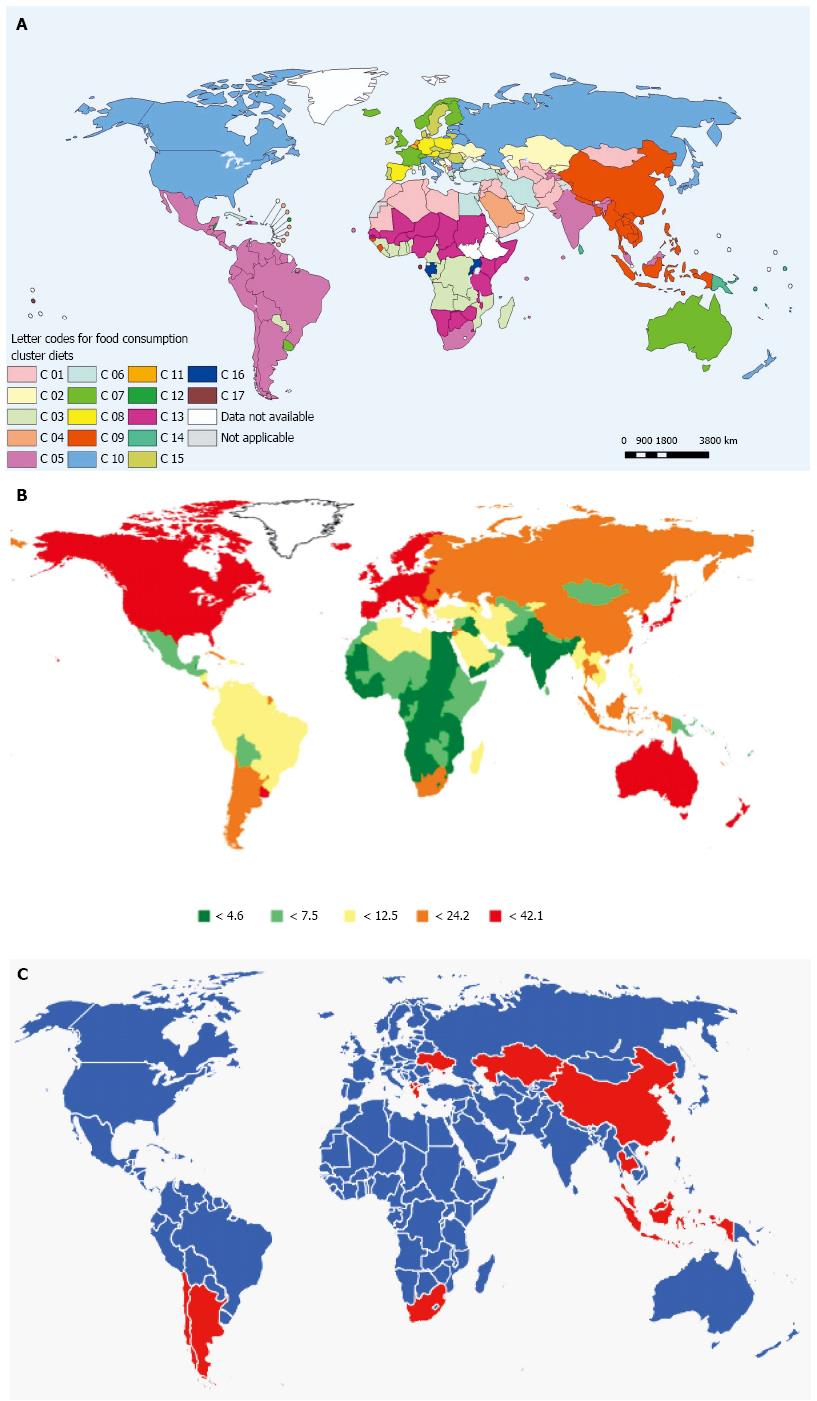
Figure 1 Comparison of the regional food consumption in the world, and the global spread of colorectal cancer, based on the data from Globocan 2008.
A: Global cluster analysis based on 62 marker foods from 2002-2007 food supply data, reproduced with permission from World Health Organization GEMS/Food cluster diets analysis 2012 (details at http://www.who.int/foodsafety/chem/gems/en/index1.html). The analysis defined 17 diet clusters representing 179 countries for which food supply data were available. Here we highlight two major food clusters based on consumption of meat and fat, the major dietary colorectal cancer (CRC) risk factors. Clusters G7, 8, 10, 11 and 15 are in the high-meat-fat group, characterized by predominance of mammalian meat consumption (all > 108 g/d) and high total fat intake (all > 73 g/d). The low meat-fat group consists of clusters with lower mammalian meat consumption (all < 80 g/d) and lower overall fat intake (all < 51 g/d). Interestingly other high-risk dietary factors for CRC, such as overall high total food intake (> 2000 g/d) and total alcohol intake (> 200 g/d) are also associated with the meat-fat based diet group. The low-meat-fat group generally has lower total intake (except cluster G2) and lower total alcohol consumption (except cluster G16). The dietary profile in the low-meat-fat group is more heterogeneous, with variable intakes of other foods, such as fruit, vegetable, and cereal; B: CRC age-standardized incidence rates (ASR) per 100000 individuals per geographic region, as extracted from Globocan 2008[37]. Here we define regions with ASR of ≥ 24.2 as high-rate (red and orange), and regions with ASR < 24.2 (light green, dark green and yellow) as low-rate; C: Visual matching of the global regional CRC rates and dietary patterns, based on the groups defined above. Matching occurs when a region with high-meat-fat diet is high-rate for CRC, or when a region with low-meat-fat diet is low-rate for CRC. The regions where the CRC rates matched dietary pattern are in blue, those where it did not match in red (i.e., high-rate CRC regions with low-meat-fat diet or low-rate CRC regions with high-meat-fat diet).
- Citation: Bishehsari F, Mahdavinia M, Vacca M, Malekzadeh R, Mariani-Costantini R. Epidemiological transition of colorectal cancer in developing countries: Environmental factors, molecular pathways, and opportunities for prevention. World J Gastroenterol 2014; 20(20): 6055-6072
- URL: https://www.wjgnet.com/1007-9327/full/v20/i20/6055.htm
- DOI: https://dx.doi.org/10.3748/wjg.v20.i20.6055


