Copyright
©2014 Baishideng Publishing Group Co.
World J Gastroenterol. Apr 21, 2014; 20(15): 4300-4315
Published online Apr 21, 2014. doi: 10.3748/wjg.v20.i15.4300
Published online Apr 21, 2014. doi: 10.3748/wjg.v20.i15.4300
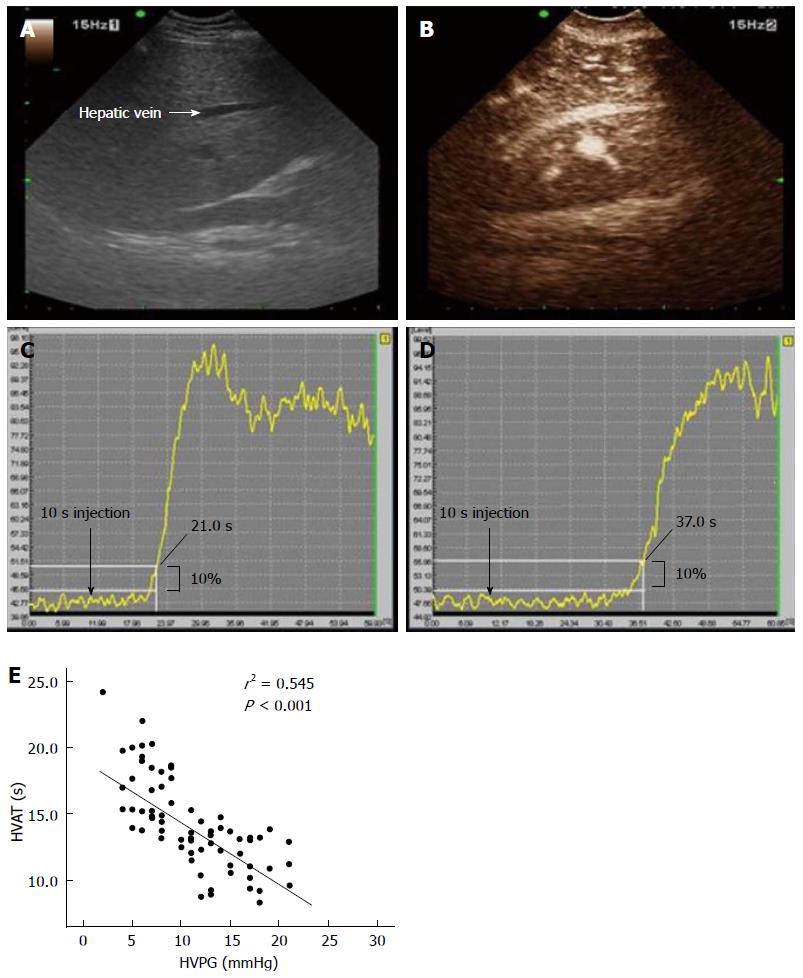
Figure 3 Hepatic vein enhancement with microbubble contrast-enhanced ultrasound and measurement of Hepatic vein arrival time and the correlation between Hepatic Venous Pressure Gradient and Hepatic vein arrival time.
A: Ultrasound images showing the HV (white arrows) before the contrast injection; B: Arrival of microbubble contrast agent in the HV after contrast enhancement; HVAT was calculated as the time (in seconds) from injection to a sustained increase in signal in the TIC to more than 10% above baseline; C: Recorded TIC profile shows early HVAT (11.0 s; the 10-s lead time was subtracted from 21.0 s) in a patient with cirrhosis with HVPG of 20 mmHg; D: Recorded TIC profile shows an HVAT of 27.0 s (37.0 min 10 s) in a healthy control; E: HVAT was significantly linearly correlated with HVPG in the patients with compensated cirrhosis (r2 = 0.545; P < 0.001). HV: Hepatic vein; CEUS: Contrast-enhanced ultrasonography; HVAT: Hepatic vein arrival time; HVPG: Hepatic venous pressure gradient; TIC: Time intensity curve[102].
- Citation: Kim MY, Jeong WK, Baik SK. Invasive and non-invasive diagnosis of cirrhosis and portal hypertension. World J Gastroenterol 2014; 20(15): 4300-4315
- URL: https://www.wjgnet.com/1007-9327/full/v20/i15/4300.htm
- DOI: https://dx.doi.org/10.3748/wjg.v20.i15.4300


