Copyright
©2013 Baishideng Publishing Group Co.
World J Gastroenterol. Dec 28, 2013; 19(48): 9294-9306
Published online Dec 28, 2013. doi: 10.3748/wjg.v19.i48.9294
Published online Dec 28, 2013. doi: 10.3748/wjg.v19.i48.9294
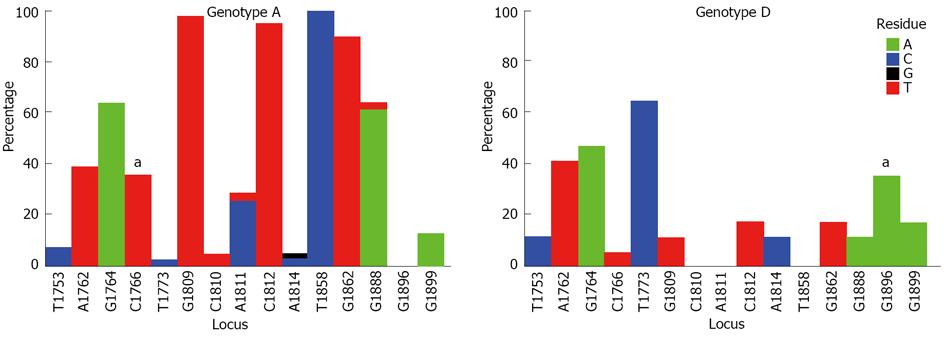
Figure 3 Comparison of the distribution of mutations in the basic core promoter/precore region (1742-1901 from the EcoR1 site) in genotypes A (62 isolates) and D (23 isolates).
Graphs showing the percentage of mutant residues relative to the reference motif found at the 15 loci of interest (1753, 1762, 1764, 1766, 1773, 1809-1812, 1814, 1858, 1862, 1888, 1896 and 1899). The study sequence files were submitted to the Mutation Reporter Tool[49] to produce the graphs. The reference motifs used were TAGCTGCACACGGGG (genotype A) and TAGCTGCACATGGGG (genotype D) for comparison. This is also shown by the letter preceding each locus on the X-axis. To facilitate direct comparisons between the graphs, conserved loci were not suppressed and the Y-axis was scaled to 100% by selecting the appropriate controls on the input page of the Mutation Reporter Tool. Nucleotides: A (green), C (dark blue), G (black), T (red). aSignificantly associated with the respective genotype.
- Citation: Gopalakrishnan D, Keyter M, Shenoy KT, Leena KB, Thayumanavan L, Thomas V, Vinayakumar K, Panackel C, Korah AT, Nair R, Kramvis A. Hepatitis B virus subgenotype A1 predominates in liver disease patients from Kerala, India. World J Gastroenterol 2013; 19(48): 9294-9306
- URL: https://www.wjgnet.com/1007-9327/full/v19/i48/9294.htm
- DOI: https://dx.doi.org/10.3748/wjg.v19.i48.9294


