Copyright
©2013 Baishideng Publishing Group Co.
World J Gastroenterol. Dec 21, 2013; 19(47): 9020-9033
Published online Dec 21, 2013. doi: 10.3748/wjg.v19.i47.9020
Published online Dec 21, 2013. doi: 10.3748/wjg.v19.i47.9020
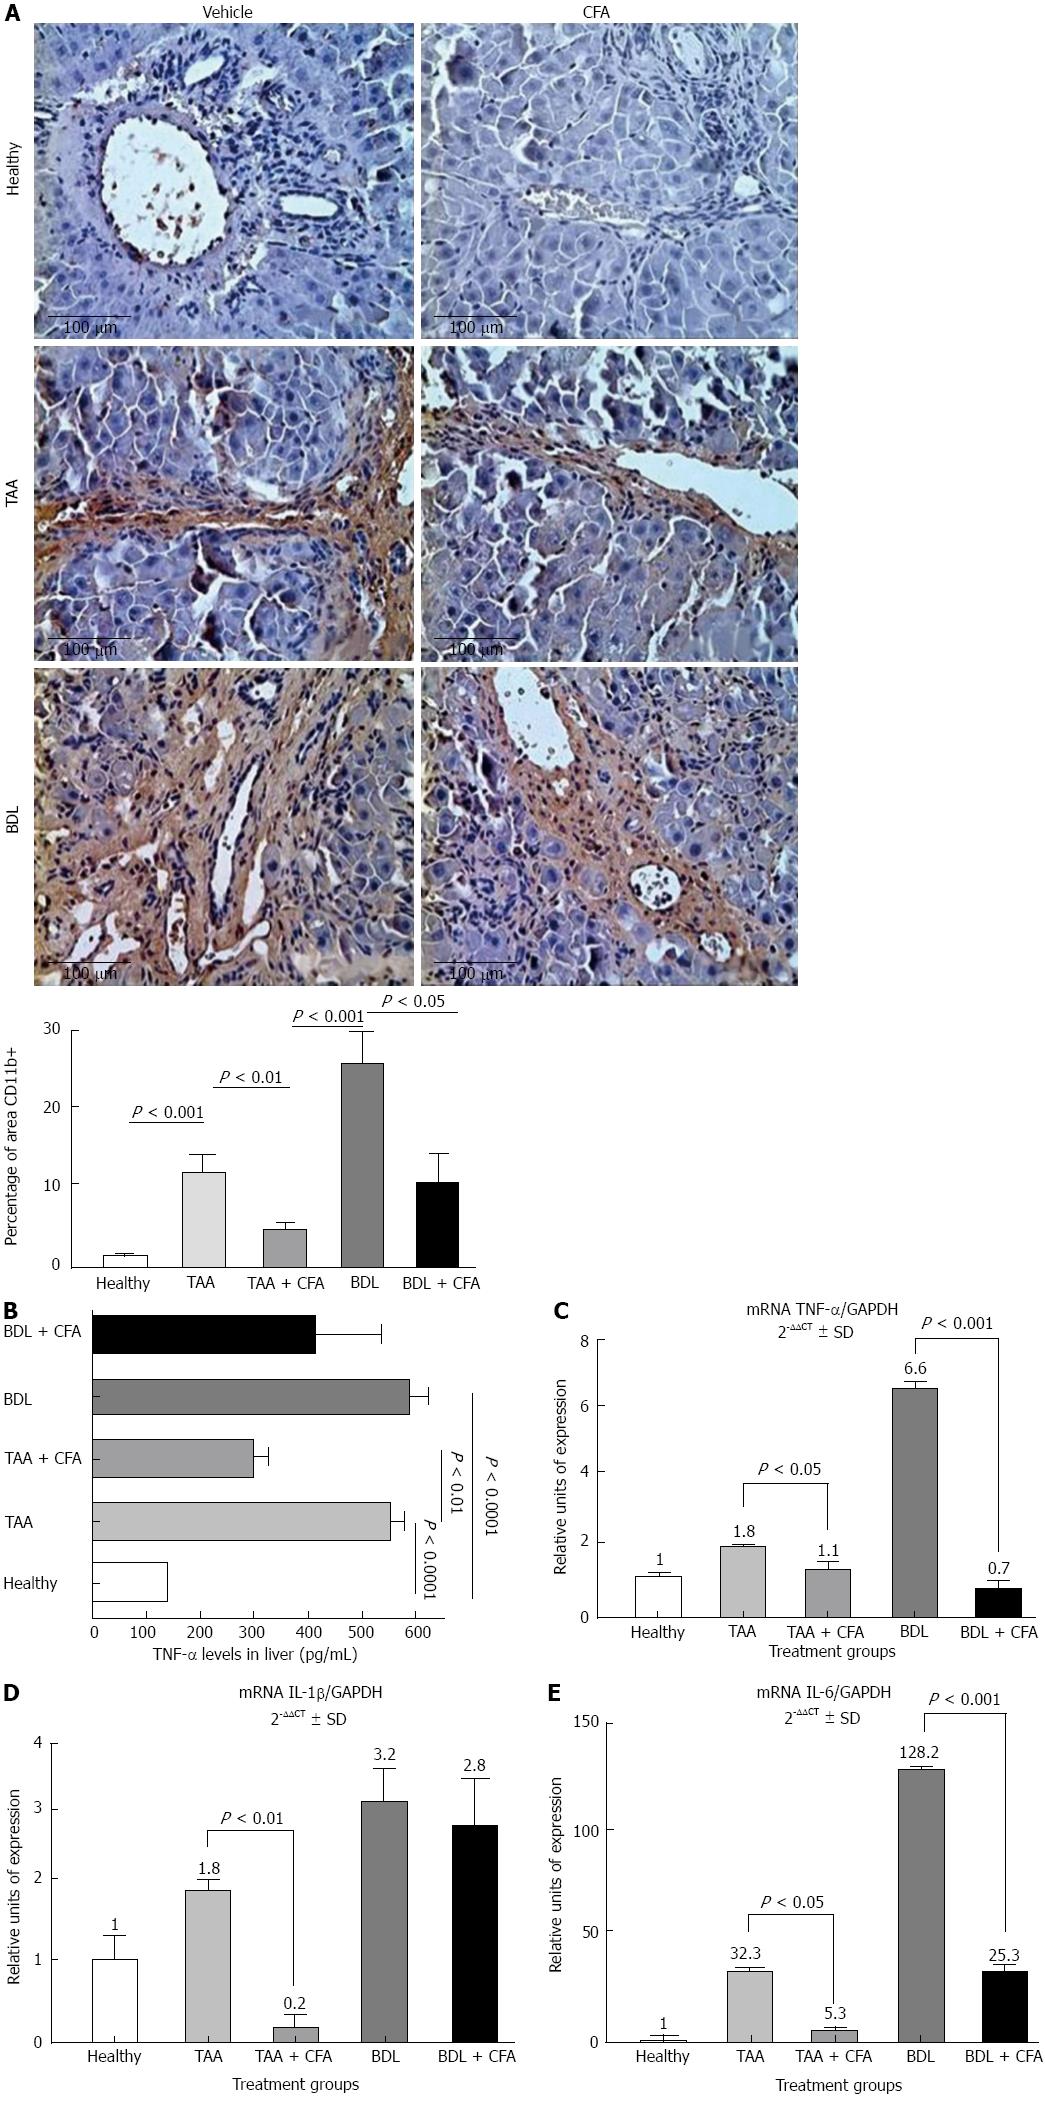
Figure 3 Expression of inflammatory genes in liver.
A: Immunohistochemistry for CD11b, sections 4 μm thick, stained with Masson’s trichrome, × 40. Results for CD11b positive area are shown as percentage; B: Tumor necrosis factor alpha (TNF-α) liver levels in different groups of treatment, performed by enzyme-linked immunosorbant assay; C-E: Reverse transcription-polymerase chain reaction were performed for TNF-α, interleukin-1β (IL-1β), IL-6. Gene amplification was normalized against glyceraldehyde 3-phosphate dehydrogenase (GAPDH) expression. TAA: Thioacetamide; BDL: Bile duct ligation. CFA: Caffeine.
- Citation: Gordillo-Bastidas D, Oceguera-Contreras E, Salazar-Montes A, González-Cuevas J, Hernández-Ortega LD, Armendáriz-Borunda J. Nrf2 and Snail-1 in the prevention of experimental liver fibrosis by caffeine. World J Gastroenterol 2013; 19(47): 9020-9033
- URL: https://www.wjgnet.com/1007-9327/full/v19/i47/9020.htm
- DOI: https://dx.doi.org/10.3748/wjg.v19.i47.9020


