Copyright
©2013 Baishideng Publishing Group Co.
World J Gastroenterol. Oct 21, 2013; 19(39): 6568-6578
Published online Oct 21, 2013. doi: 10.3748/wjg.v19.i39.6568
Published online Oct 21, 2013. doi: 10.3748/wjg.v19.i39.6568
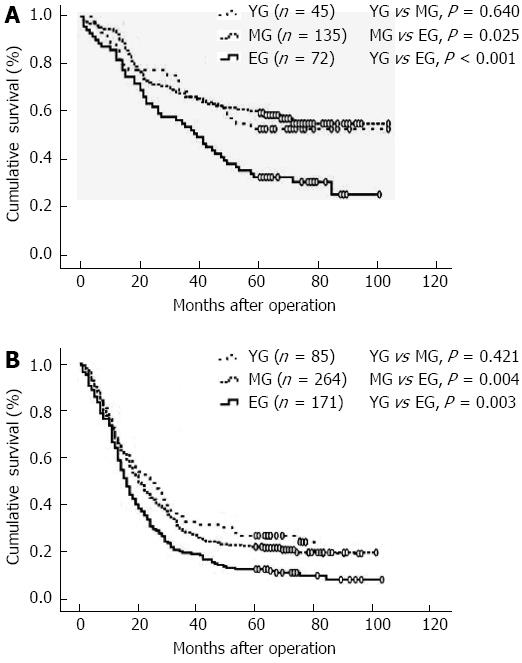
Figure 2 Overall survival curves for patients with tumor–node–metastasis II and III cancer.
In the tumor-node-metastasis (TNM)-stratified analysis, the differences in overall survival (OS) were only observed in patients with TNM stage II and III cancer. A: Patients with II cancer; B: Patients with III cancer. EG: Elderly group; MG: Middle-aged group; YG: Younger group.
- Citation: Liang YX, Deng JY, Guo HH, Ding XW, Wang XN, Wang BG, Zhang L, Liang H. Characteristics and prognosis of gastric cancer in patients aged ≥ 70 years. World J Gastroenterol 2013; 19(39): 6568-6578
- URL: https://www.wjgnet.com/1007-9327/full/v19/i39/6568.htm
- DOI: https://dx.doi.org/10.3748/wjg.v19.i39.6568


