Copyright
©2013 Baishideng Publishing Group Co.
World J Gastroenterol. Jul 28, 2013; 19(28): 4495-4503
Published online Jul 28, 2013. doi: 10.3748/wjg.v19.i28.4495
Published online Jul 28, 2013. doi: 10.3748/wjg.v19.i28.4495
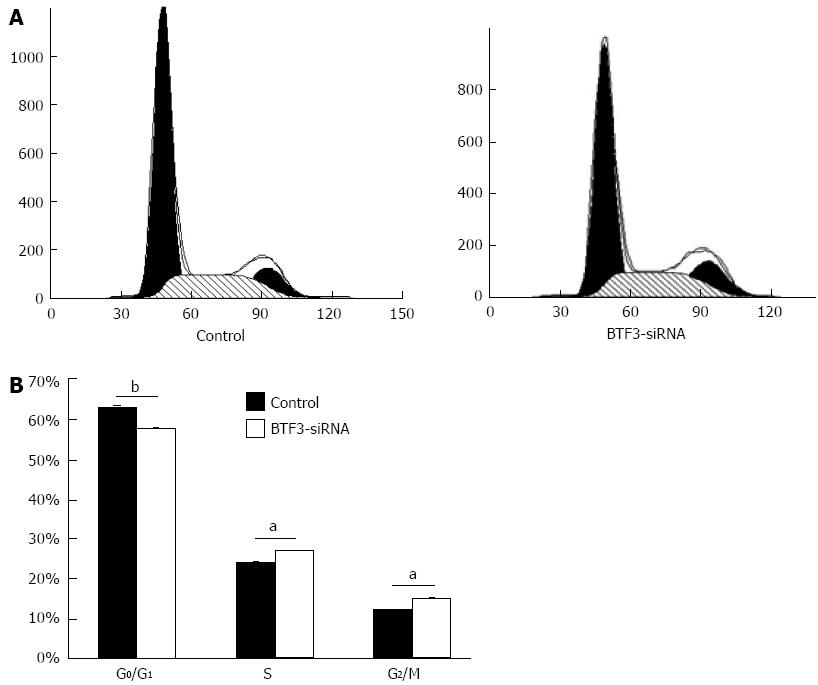
Figure 4 Flow cytometric assays.
A: Cell-cycle stages of control and basic transcription factor 3 (BTF3)-small interfering RNA (siRNA) transfected cells were analyzed by flow cytometry. Data are presented as a histogram, with cell number (y-axis) plotted against DNA content (x-axis); B: Cells arrested at different cell-cycle stages were plotted as bar charts. aP < 0.05, bP < 0.01 between groups was assessed by unpaired t test and comparisons were considered significantly different.
- Citation: Liu Q, Zhou JP, Li B, Huang ZC, Dong HY, Li GY, Zhou K, Nie SL. Basic transcription factor 3 is involved in gastric cancer development and progression. World J Gastroenterol 2013; 19(28): 4495-4503
- URL: https://www.wjgnet.com/1007-9327/full/v19/i28/4495.htm
- DOI: https://dx.doi.org/10.3748/wjg.v19.i28.4495


