Copyright
©2013 Baishideng Publishing Group Co.
World J Gastroenterol. Jul 28, 2013; 19(28): 4495-4503
Published online Jul 28, 2013. doi: 10.3748/wjg.v19.i28.4495
Published online Jul 28, 2013. doi: 10.3748/wjg.v19.i28.4495
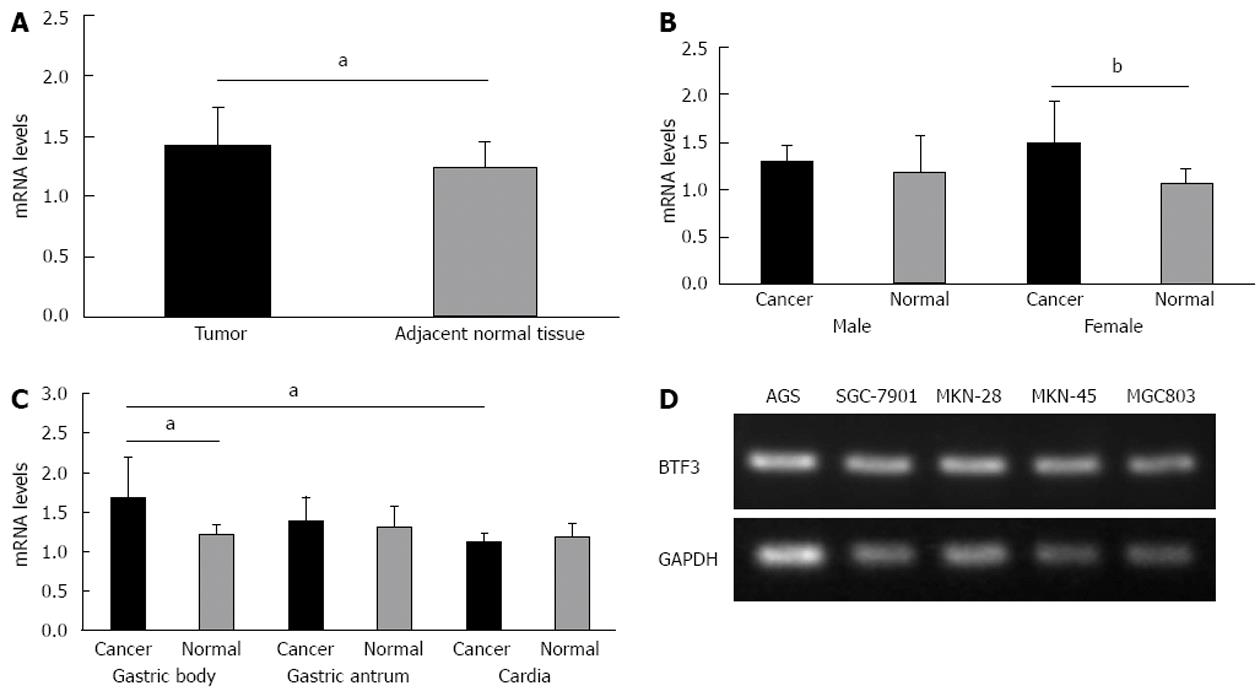
Figure 1 Level of basic transcription factor 3 expression in gastric cancer and tumor cell lines.
A: Bar charts represent the mRNA levels of basic transcription factor 3 (BTF3) in gastric tumor and adjacent normal tissue measured by quantitative real-time polymerase chain reaction (PCR); B: BTF3 mRNA expression data from (A) further classified by gender; C: BTF3 expression pattern among gastric body, gastric antrum and cardia tumors; D: The expression of BTF3 mRNA was detected by quantitative real-time PCR among different cell lines. Glyceraldehyde-3-phosphate dehydrogenase (GAPDH) was used as the reference gene. Black bars represent tumors and gray bars normal tissues. The difference in BTF3 expression, aP < 0.05, bP < 0.01 between groups was assessed by unpaired t test and considered significantly different.
- Citation: Liu Q, Zhou JP, Li B, Huang ZC, Dong HY, Li GY, Zhou K, Nie SL. Basic transcription factor 3 is involved in gastric cancer development and progression. World J Gastroenterol 2013; 19(28): 4495-4503
- URL: https://www.wjgnet.com/1007-9327/full/v19/i28/4495.htm
- DOI: https://dx.doi.org/10.3748/wjg.v19.i28.4495


