Copyright
©2012 Baishideng Publishing Group Co.
World J Gastroenterol. Nov 14, 2012; 18(42): 6076-6087
Published online Nov 14, 2012. doi: 10.3748/wjg.v18.i42.6076
Published online Nov 14, 2012. doi: 10.3748/wjg.v18.i42.6076
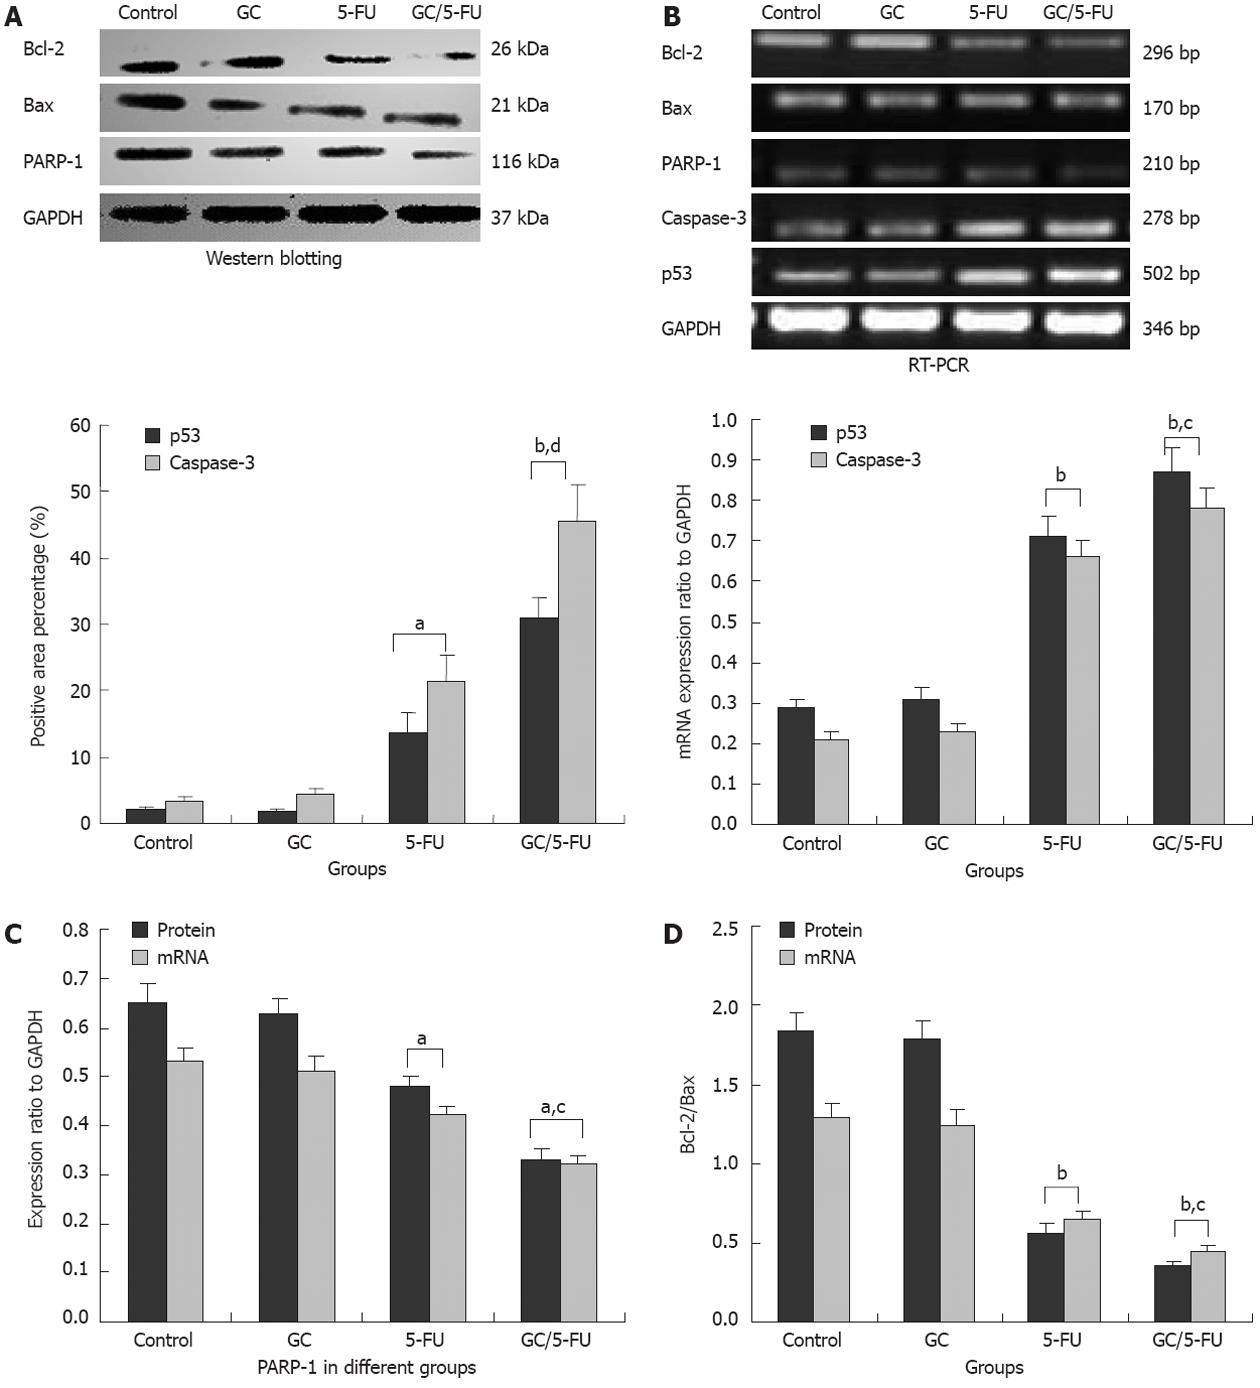
Figure 7 Expression of p53, caspase-3, Bax, Bcl-2 and poly adenosine 50-diphosphate-ribose polymerase 1 in the tumor tissues from mice with different treatments.
A: Quantification of p53 and caspase-3 expression as detected by immunohistochemistry and shown pictorially in Figures 6 and 7; B: mRNA levels of p53 and caspase-3 in individual tissues was measured by reverse transcription-polymerase chain reaction (RT-PCR), and normalized to glyceraldehyde-3-phosphate dehydrogenase (GAPDH); C: Poly adenosine 50-diphosphate-ribose polymerase 1 (PARP-1) expression in individual tumor samples was determined by both RT-PCR and western blot analysis; results were normalized to GAPDH; D: Expression of Bcl-2 and Bax was quantified by both RT-PCR and Western blotting; the ratio of Bcl-2/Bax was shown. aP < 0.05, bP < 0.01 vs control group; cP < 0.05, dP < 0.01 vs 5-fluorouracil (5-FU) group. GC: Galactosylated chitosan.
- Citation: Cheng MR, Li Q, Wan T, He B, Han J, Chen HX, Yang FX, Wang W, Xu HZ, Ye T, Zha BB. Galactosylated chitosan/5-fluorouracil nanoparticles inhibit mouse hepatic cancer growth and its side effects. World J Gastroenterol 2012; 18(42): 6076-6087
- URL: https://www.wjgnet.com/1007-9327/full/v18/i42/6076.htm
- DOI: https://dx.doi.org/10.3748/wjg.v18.i42.6076


