Copyright
©2012 Baishideng Publishing Group Co.
World J Gastroenterol. Sep 7, 2012; 18(33): 4585-4592
Published online Sep 7, 2012. doi: 10.3748/wjg.v18.i33.4585
Published online Sep 7, 2012. doi: 10.3748/wjg.v18.i33.4585
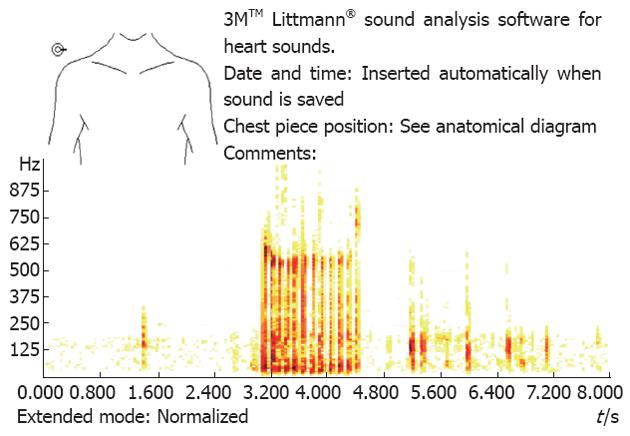
Figure 2 Example of bowel sound recording displayed in the “spectrum” view.
This chart shows the sound frequency spectrum and the relative intensity of each sound frequency (darker colour indicates higher sound intensity at the frequency indicated along the y-axis) for the same recording used for Figure 1.
- Citation: Ching SS, Tan YK. Spectral analysis of bowel sounds in intestinal obstruction using an electronic stethoscope. World J Gastroenterol 2012; 18(33): 4585-4592
- URL: https://www.wjgnet.com/1007-9327/full/v18/i33/4585.htm
- DOI: https://dx.doi.org/10.3748/wjg.v18.i33.4585


