Copyright
©2011 Baishideng Publishing Group Co.
World J Gastroenterol. Mar 14, 2011; 17(10): 1267-1275
Published online Mar 14, 2011. doi: 10.3748/wjg.v17.i10.1267
Published online Mar 14, 2011. doi: 10.3748/wjg.v17.i10.1267
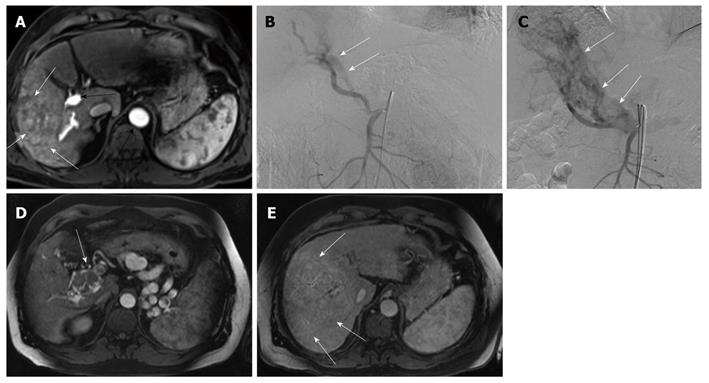
Figure 6 A 58-year-old male patient with alcoholic cirrhosis.
A: Axial magnetic resonance imaging (MRI) T1 post contrast weighted image showing an ill defined mass in segments 5 and 6 (white arrows). Note enhancement of the portal vein (black arrow) in the arterial phase (black arrow head at the aorta) denoting an underlying arterioportal shunt; B: Digital subtraction angiography showing opacified portal vein (white arrows) during the arterial phase (APS) (white arrows); C: Digital subtraction angiography during the last (6th) transarterial chemoembolization (TACE) showing the APS with markedly dilated and partially thrombosed portal vein (white arrows); D, E: Axial MRI T1 post contrast after the last TACE showing tumor infiltration of the dilated main portal vein (white arrow in Figure 6D) and progression of the tumor size (> 20%) by MRI volumetry (white arrows in Figure 6E) (white arrows).
- Citation: Vogl TJ, Nour-Eldin NE, Emad-Eldin S, Naguib NN, Trojan J, Ackermann H, Abdelaziz O. Portal vein thrombosis and arterioportal shunts: Effects on tumor response after chemoembolization of hepatocellular carcinoma. World J Gastroenterol 2011; 17(10): 1267-1275
- URL: https://www.wjgnet.com/1007-9327/full/v17/i10/1267.htm
- DOI: https://dx.doi.org/10.3748/wjg.v17.i10.1267


