Copyright
©2010 Baishideng.
World J Gastroenterol. Apr 7, 2010; 16(13): 1598-1609
Published online Apr 7, 2010. doi: 10.3748/wjg.v16.i13.1598
Published online Apr 7, 2010. doi: 10.3748/wjg.v16.i13.1598
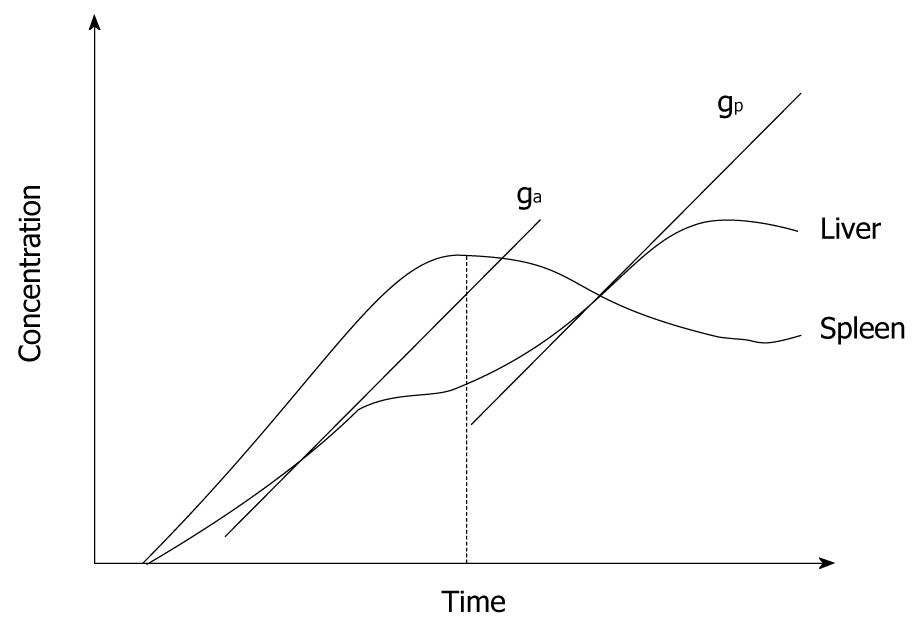
Figure 4 Schematic plot of gadolinium concentration-time curve in liver tissue obtained from a perfusion MRI study.
The diagram illustrates how the maximum gradient for arterial perfusion (ga) and portal perfusion (gp) are derived (based on Miles et al[2]). Note that the peak splenic enhancement is used to define the transition between arterial and portal phase of liver parenchyma enhancement. The maximum slope after the peak splenic enhancement is used to define portal perfusion.
- Citation: Thng CH, Koh TS, Collins DJ, Koh DM. Perfusion magnetic resonance imaging of the liver. World J Gastroenterol 2010; 16(13): 1598-1609
- URL: https://www.wjgnet.com/1007-9327/full/v16/i13/1598.htm
- DOI: https://dx.doi.org/10.3748/wjg.v16.i13.1598


