Copyright
©2009 The WJG Press and Baishideng.
World J Gastroenterol. Feb 7, 2009; 15(5): 538-551
Published online Feb 7, 2009. doi: 10.3748/wjg.15.538
Published online Feb 7, 2009. doi: 10.3748/wjg.15.538
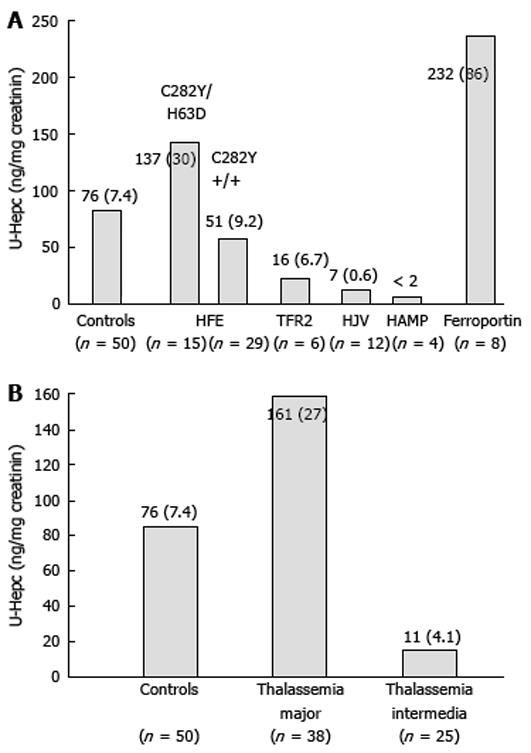
Figure 2 Mean (SE) values of urinary hepcidin (U-hepc), measured as described[20], in patients with different forms of hemochromatosis (A) and in patients with thalassemia major and intermedia (B) compared with healthy controls.
Data collected from personal unpublished results and from Barisani et al[67], Cremonesi et al[82], Kattamis et al[90], Matthes et al[116], Nemeth et al[18], Origa et al[91], Papanikolau et al[117], Papanikolau et al[19], Piperno et al[20]. (P < 0.05: Controls vs C282Y +/+) (P < 0.01: Controls vs others; C282Y +/+ vs C282Y/H63D, HJV and Fp; HJV vs Fp; Thalassemia Major vs Intermedia). Statistical analysis was not performed for TFR2 and HAMP due to the small number of patients.
- Citation: Piperno A, Mariani R, Trombini P, Girelli D. Hepcidin modulation in human diseases: From research to clinic. World J Gastroenterol 2009; 15(5): 538-551
- URL: https://www.wjgnet.com/1007-9327/full/v15/i5/538.htm
- DOI: https://dx.doi.org/10.3748/wjg.15.538


