Copyright
©2009 The WJG Press and Baishideng.
World J Gastroenterol. Aug 14, 2009; 15(30): 3776-3782
Published online Aug 14, 2009. doi: 10.3748/wjg.15.3776
Published online Aug 14, 2009. doi: 10.3748/wjg.15.3776
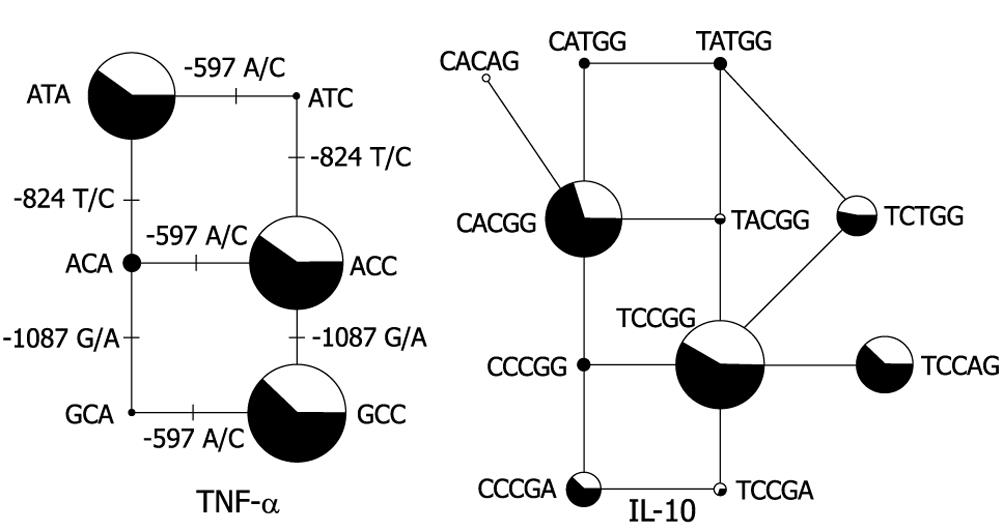
Figure 2 TNF-α and IL-10 haplotype networks.
The haplotype networks were drawn using the Phylogenetic Network Analysis Software NETWORK 4.1.1.2[10]. Left: IL-10 haplotypes are named as listed in Table 6; Right: TNF-α haplotypes are named as listed in Table 8. The area of the circle is proportional to the overall haplotype frequency, while colors indicate the distribution among CD patients (black) and controls (white). The solid lines connecting each haplotype represent single mutations occurring without recombination, and correspond to the maximum parsimony tree for this network. “ANC” designates the ancestral promoter haplotype derived from chimpanzee DNA analysis.
- Citation: Sanchez R, Levy E, Costea F, Sinnett D. IL-10 and TNF-α promoter haplotypes are associated with childhood Crohn’s disease location. World J Gastroenterol 2009; 15(30): 3776-3782
- URL: https://www.wjgnet.com/1007-9327/full/v15/i30/3776.htm
- DOI: https://dx.doi.org/10.3748/wjg.15.3776


