Copyright
©2009 The WJG Press and Baishideng.
World J Gastroenterol. Jan 21, 2009; 15(3): 300-309
Published online Jan 21, 2009. doi: 10.3748/wjg.15.300
Published online Jan 21, 2009. doi: 10.3748/wjg.15.300
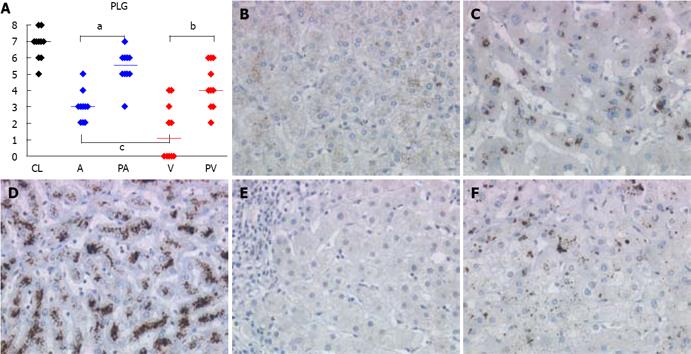
Figure 4 PLG protein expression in control liver, HCC-free and HCC-associated cirrhosis.
The PLG protein levels were determined by immunohistochemistry (magnification x 20). A: Every protein level (IP score) per cirrhosis type is expressed on the ordinate. The mean value of protein level is shown as an horizontal bar. The samples abbreviations are the same as for Figure 3. Significant differences between A and PA (aP < 0.05), between V and PV (bP < 0.05), between A and V (cP < 0.05). B-F: PLG immunostaining of hepatic sections corresponding to alcoholic HCC-free cirrhosis (B), alcoholic HCC-associated cirrhosis (C), control liver (D), HCV-related HCC-free cirrhosis (E) and HCV-related HCC-associated cirrhosis (F).
- Citation: Caillot F, Derambure C, Bioulac-Sage P, François A, Scotte M, Goria O, Hiron M, Daveau M, Salier JP. Transient and etiology-related transcription regulation in cirrhosis prior to hepatocellular carcinoma occurrence. World J Gastroenterol 2009; 15(3): 300-309
- URL: https://www.wjgnet.com/1007-9327/full/v15/i3/300.htm
- DOI: https://dx.doi.org/10.3748/wjg.15.300


