Copyright
©2008 The WJG Press and Baishideng.
World J Gastroenterol. Dec 14, 2008; 14(46): 7059-7067
Published online Dec 14, 2008. doi: 10.3748/wjg.14.7059
Published online Dec 14, 2008. doi: 10.3748/wjg.14.7059
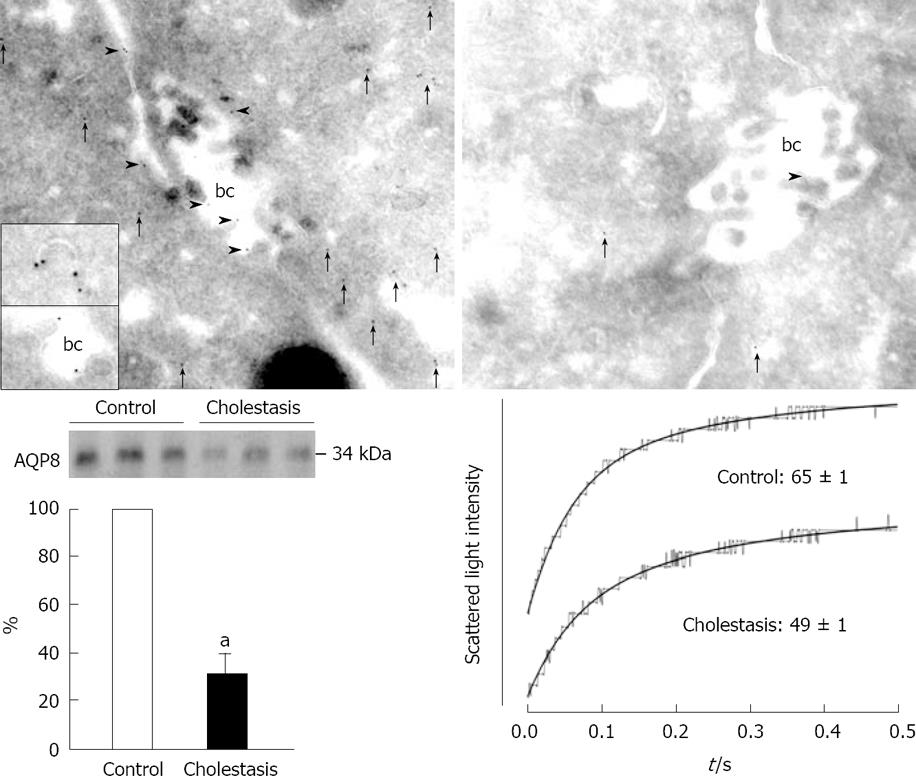
Figure 2 Functional expression of AQP8 in normal and cholestatic liver.
Superior panel: Immunogold electron microscopy for AQP8 in liver from control (left) and 7-d BDL rats (right). Arrowheads indicate AQP8 in bile canalicular (bc) membranes. Arrows indicate AQP8 in the pericanalicular cytoplasm. The upper inset shows an AQP8-containing vesicle, and the lower insert shows AQP8 in the tip of a microvillus and in the intermicrovillar plasma membrane region. (Original magnification X 60 000) Modified and reproduced with permission[57]. Inferior panel: On the left, anti-AQP8 immunoblot of the canalicular plasma membranes from normal and LPS-induced cholestatic liver. On the right, water permeability assessment of canalicular membranes from LPS-induced cholestatic liver. Typical tracings of a time course of scattered light intensity (osmotic water transport), along with single exponential fits in canalicular plasma membrane vesicles in response to a 250 mosM hypertonic sucrose gradient. Calculated Pf values (μm/s) are shown under each curve. Data are mean ± SE from 3 independent vesicle preparations. aP < 0.05 vs conrtol. Modified and reproduced with permission[64].
- Citation: Lehmann GL, Larocca MC, Soria LR, Marinelli RA. Aquaporins: Their role in cholestatic liver disease. World J Gastroenterol 2008; 14(46): 7059-7067
- URL: https://www.wjgnet.com/1007-9327/full/v14/i46/7059.htm
- DOI: https://dx.doi.org/10.3748/wjg.14.7059


