Copyright
©2008 The WJG Press and Baishideng.
World J Gastroenterol. Apr 7, 2008; 14(13): 2010-2022
Published online Apr 7, 2008. doi: 10.3748/wjg.14.2010
Published online Apr 7, 2008. doi: 10.3748/wjg.14.2010
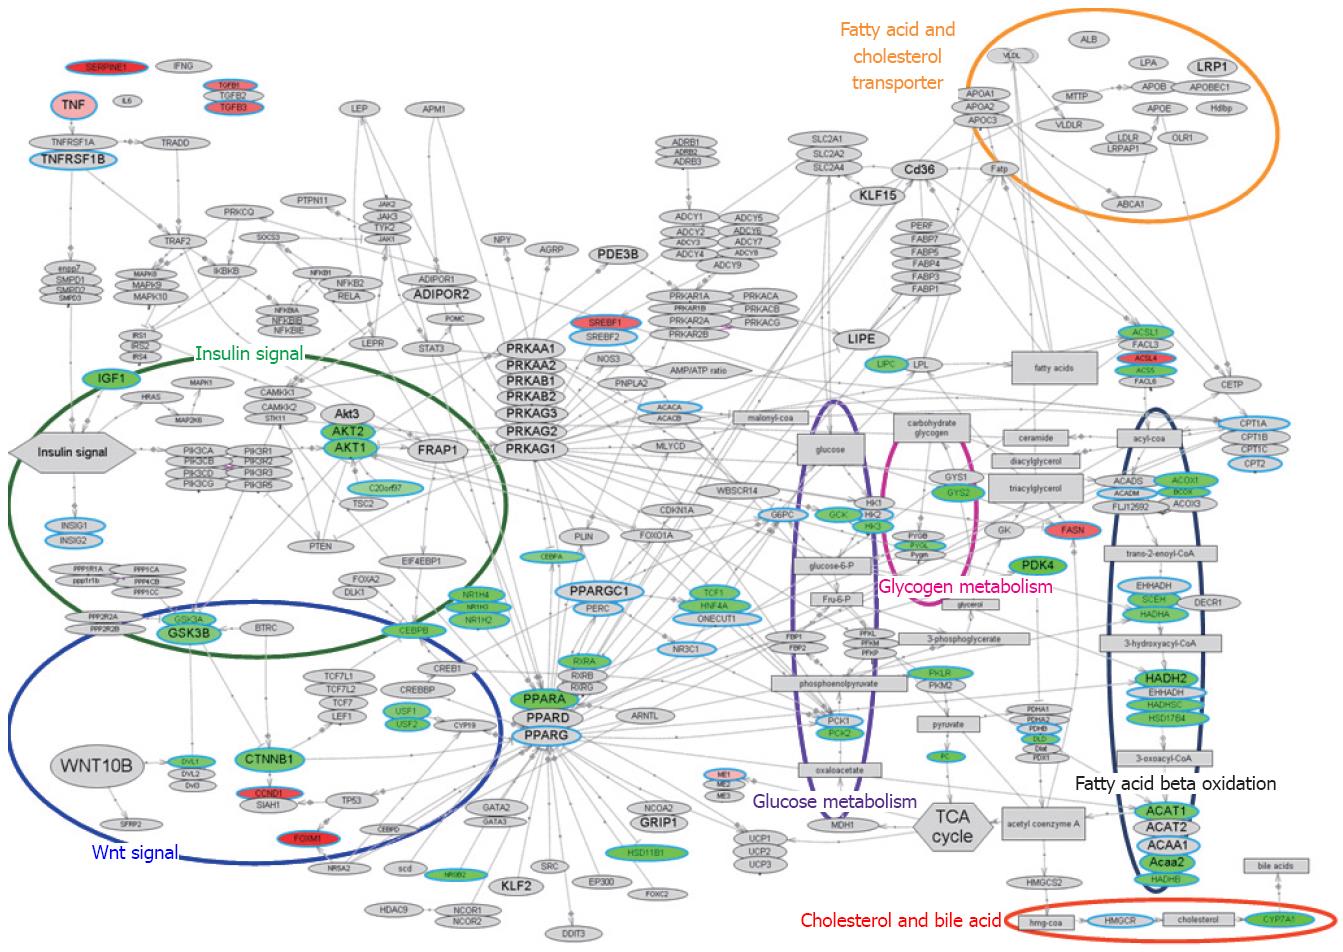
Figure 3 Molecular network associated with lipid metabolism.
Gene expression changes in pathways related to lipid metabolism, illustrated with bioSpace Explorer (a system for analysis of DNA microarray data for lipid metabolism; Pharma Frontier Co. Ltd / World Fusion Co. Ltd.; see texts for details). The bird’s-eye view of the lipid metabolism is displayed. The up-regulated and down-regulated gene expression ratios at F3 vs F1 in Table 1 are displayed in red and green, respectively, with the color gradation proportional to the ratio. Genes in Table 1 that did not show a statistically significant change in expression are indicated with a blue circle with gray background. An entry with a gray background only indicates no input data. Most of the entity names in Figure 2 are the same as the gene name in Table 1, but the names “C20orf97”, “SCEH”, “Acaa2”, and “ACS5” in Figure 2 refer to “TRIB3”, “ECHS1”, “ACAA2”, and “ACSL5”, respectively, in Table 1. These differences are due to the software used in bioSpace Explorer.
- Citation: Takahara Y, Takahashi M, Zhang QW, Wagatsuma H, Mori M, Tamori A, Shiomi S, Nishiguchi S. Serial changes in expression of functionally clustered genes in progression of liver fibrosis in hepatitis C patients. World J Gastroenterol 2008; 14(13): 2010-2022
- URL: https://www.wjgnet.com/1007-9327/full/v14/i13/2010.htm
- DOI: https://dx.doi.org/10.3748/wjg.14.2010


