Copyright
©2008 The WJG Press and Baishideng.
World J Gastroenterol. Apr 7, 2008; 14(13): 2010-2022
Published online Apr 7, 2008. doi: 10.3748/wjg.14.2010
Published online Apr 7, 2008. doi: 10.3748/wjg.14.2010
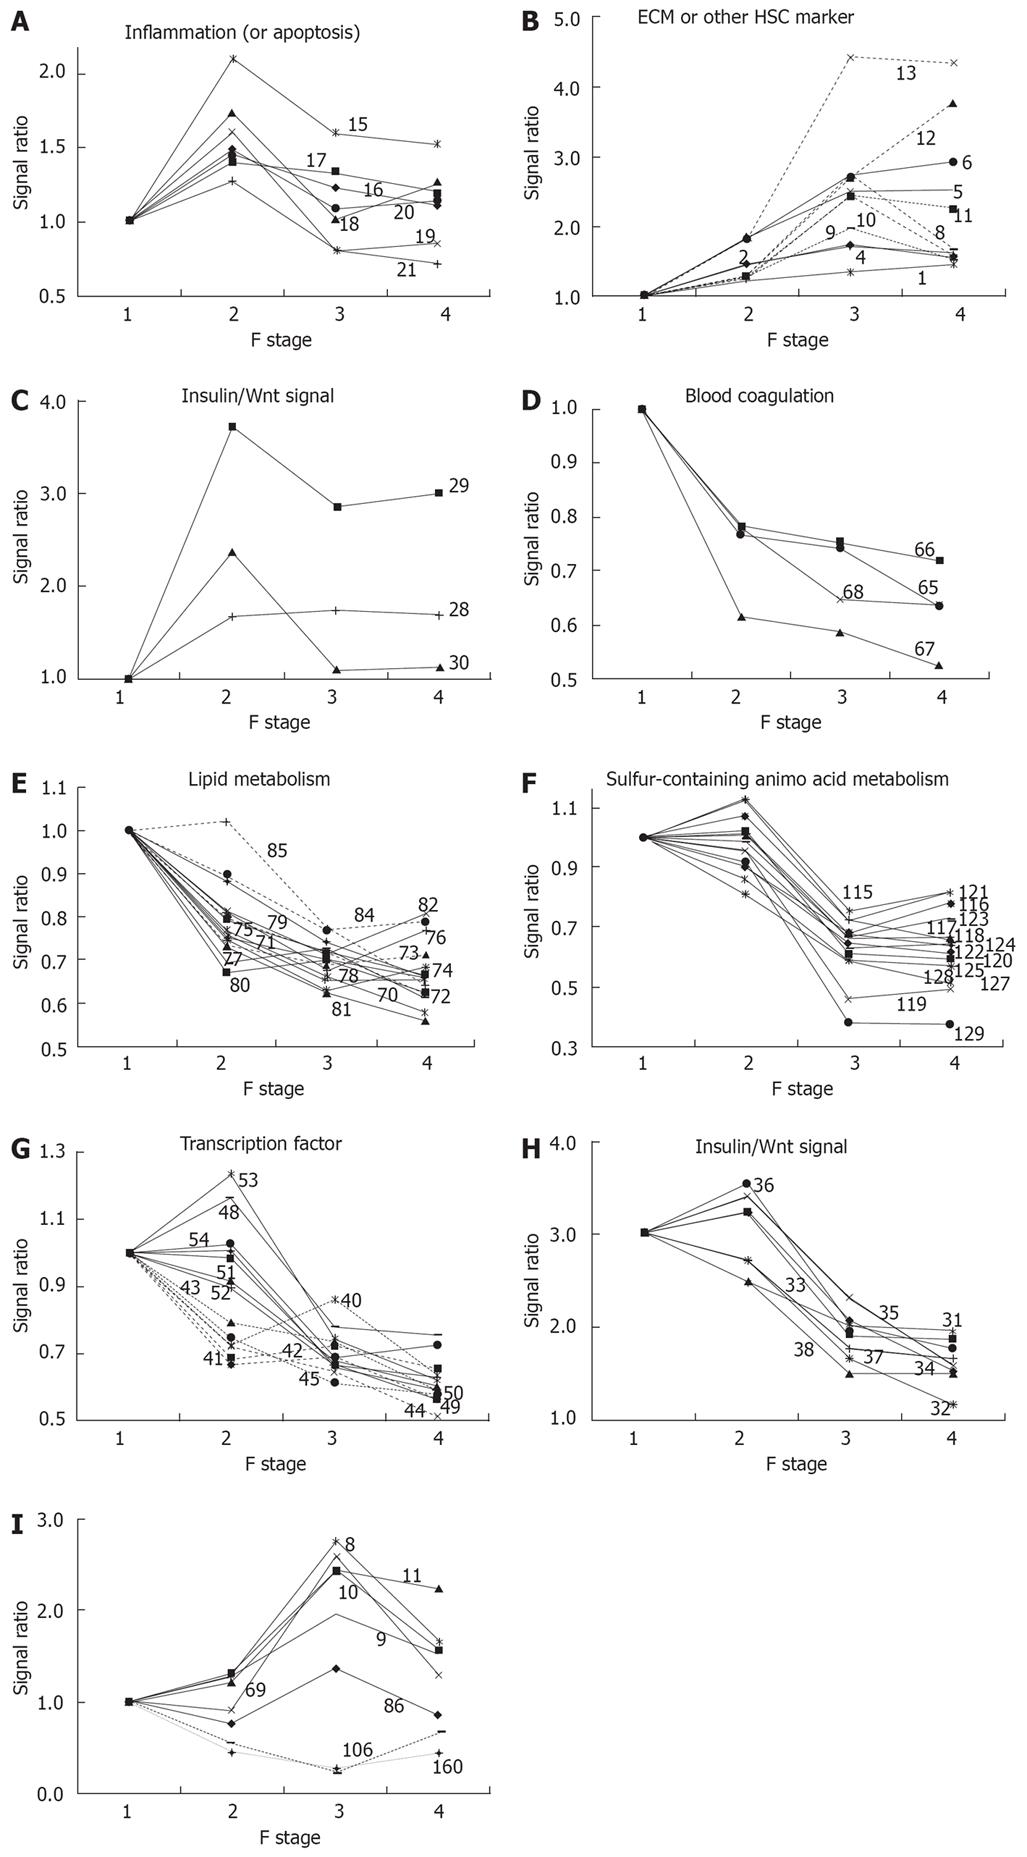
Figure 1 Clusters of genes in functional categories.
The characteristic behavior of gene clusters for each functional category is shown separately in Figure 1A-I. The numbers in each figure refer to the serial number of genes in Table 1. The expression ratio relative to the F1 stage is plotted in each graph. A: Inflammation gene cluster with a peak at F2; B: ECM gene cluster showing increased expression along with fibrosis progression; C: Insulin/Wnt signaling gene cluster with increased expression in the early phase of fibrosis; D: Blood coagulation factor gene cluster showing decreased expression along with fibrosis progression; E: Lipid metabolism gene
cluster showing decreased expression along with fibrosis progression; F: Sulfurcontaining amino acid metabolism gene cluster showing a synchronous decrease in expression from F2 to F3; G: Two transcription factor gene clusters showing sequential decreases in expression; H: Insulin/Wnt signaling gene cluster showing decreased expression from F2 to F3; I: A gene cluster showing a peak or bottom at F3.
- Citation: Takahara Y, Takahashi M, Zhang QW, Wagatsuma H, Mori M, Tamori A, Shiomi S, Nishiguchi S. Serial changes in expression of functionally clustered genes in progression of liver fibrosis in hepatitis C patients. World J Gastroenterol 2008; 14(13): 2010-2022
- URL: https://www.wjgnet.com/1007-9327/full/v14/i13/2010.htm
- DOI: https://dx.doi.org/10.3748/wjg.14.2010


