Copyright
©2008 The WJG Press and Baishideng.
World J Gastroenterol. Mar 21, 2008; 14(11): 1749-1758
Published online Mar 21, 2008. doi: 10.3748/wjg.14.1749
Published online Mar 21, 2008. doi: 10.3748/wjg.14.1749
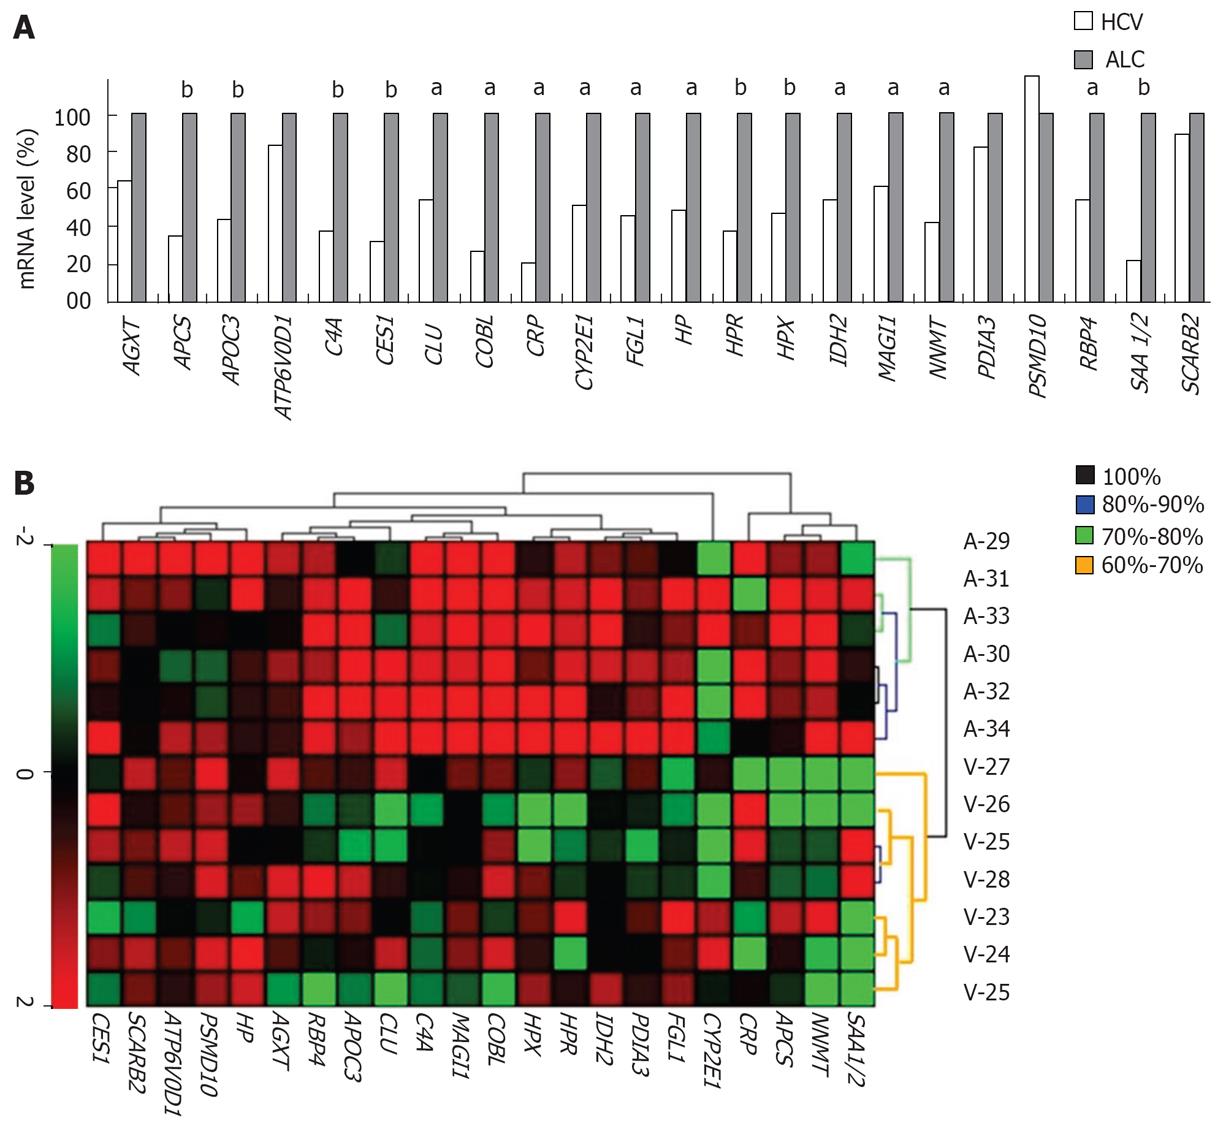
Figure 4 Data validation by qRTPCR of tumor mRNAs.
The levels of 23 transcripts (listed from Figures 2A and 3A; SAA1 and -2 are counted as 2 transcripts) were determined in tumors and normalized with the 18S RNA level. A: Every histogram depicts the mean transcript level in all patients from Table 1 (n = 35) and is expressed as a percentage of the mean level in alcoholic patients (100%). Mann and Whitney’s test (aP < 0.05; bP < 0.01). B: UHC made with qRTPCR data from our test set (n = 13). The colors in dendrogram indicate the percentage of iterations reproducibly providing the same separation. Note the significant separation of 2 major, etiology-related branches (black branches found in 100% of 103 iterations).
-
Citation: Derambure C, Coulouarn C, Caillot F, Daveau R, Hiron M, Scotte M, François A, Duclos C, Goria O, Gueudin M, Cavard C, Terris B, Daveau M, Salier JP. Genome-wide differences in hepatitis C-
vs alcoholism-associated hepatocellular carcinoma. World J Gastroenterol 2008; 14(11): 1749-1758 - URL: https://www.wjgnet.com/1007-9327/full/v14/i11/1749.htm
- DOI: https://dx.doi.org/10.3748/wjg.14.1749


