Copyright
©2006 Baishideng Publishing Group Co.
World J Gastroenterol. Oct 14, 2006; 12(38): 6149-6155
Published online Oct 14, 2006. doi: 10.3748/wjg.v12.i38.6149
Published online Oct 14, 2006. doi: 10.3748/wjg.v12.i38.6149
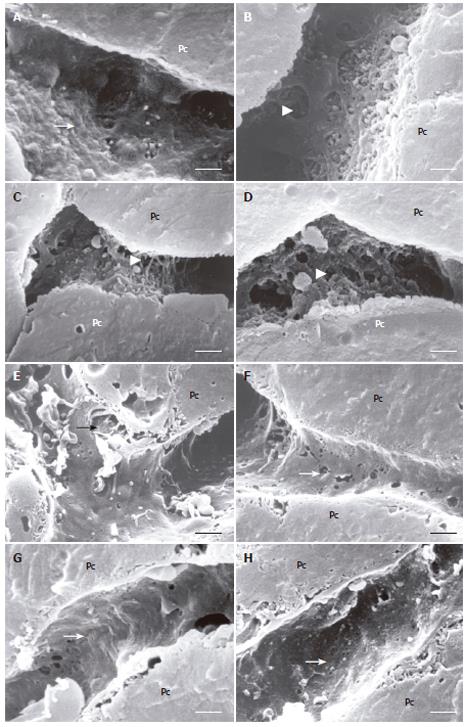
Figure 3 Scanning electron micrographs of liver sinusoids following hydrodynamic injections.
A: Control liver demonstrates an intact endothelial wall with numerous small pores perforating the endothelial lining (fenestrae) (arrow) and undisrupted bordering parenchymal cells (Pc); B: Numerous gaps (arrowhead) are observed as early as ten minutes after hydrodynamic injections and persist at one (C) and eight (D) hours after injection. From twenty four hours post HBT and onwards the number of gaps (arrowhead) decreases, yet a significant number are still present (E, F). Between seven (G) and ten (H) days following HBT, the endothelial lining reveals similar features as described under Figure 2G-H: i.e., less fenestrated appearance. Scale bars, 2 μm.
- Citation: Yeikilis R, Gal S, Kopeiko N, Paizi M, Pines M, Braet F, Spira G. Hydrodynamics based transfection in normal and fibrotic rats. World J Gastroenterol 2006; 12(38): 6149-6155
- URL: https://www.wjgnet.com/1007-9327/full/v12/i38/6149.htm
- DOI: https://dx.doi.org/10.3748/wjg.v12.i38.6149


