Copyright
©2006 Baishideng Publishing Group Co.
World J Gastroenterol. Sep 21, 2006; 12(35): 5611-5621
Published online Sep 21, 2006. doi: 10.3748/wjg.v12.i35.5611
Published online Sep 21, 2006. doi: 10.3748/wjg.v12.i35.5611
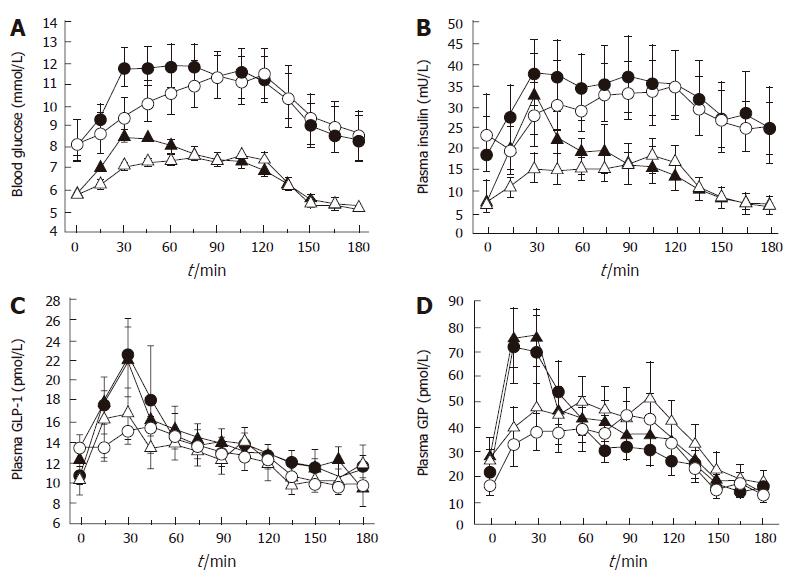
Figure 3 Effect of initially more rapid intraduodenal glucose infusion (3 kcal/min between t = 0 and 15 min and 0.
71 kcal/min between t = 15 and 120 min) (closed symbols) compared to constant infusion (1 kcal/min between t = 0 and 120 min) (open symbols) in healthy subjects (triangles) and patients with type 2 diabetes (circles) on (A) blood glucose, (B) plasma insulin, (C) plasma GLP-1, and (D) plasma GIP. Each pair of curves differs between 0 and 30 min for variable vs constant intraduodenal infusion (P < 0.05). Adapted from O’Donovan et al 2004[52].
- Citation: Chaikomin R, Rayner CK, Jones KL, Horowitz M. Upper gastrointestinal function and glycemic control in diabetes mellitus. World J Gastroenterol 2006; 12(35): 5611-5621
- URL: https://www.wjgnet.com/1007-9327/full/v12/i35/5611.htm
- DOI: https://dx.doi.org/10.3748/wjg.v12.i35.5611


