Copyright
©2006 Baishideng Publishing Group Co.
World J Gastroenterol. May 21, 2006; 12(19): 3050-3054
Published online May 21, 2006. doi: 10.3748/wjg.v12.i19.3050
Published online May 21, 2006. doi: 10.3748/wjg.v12.i19.3050
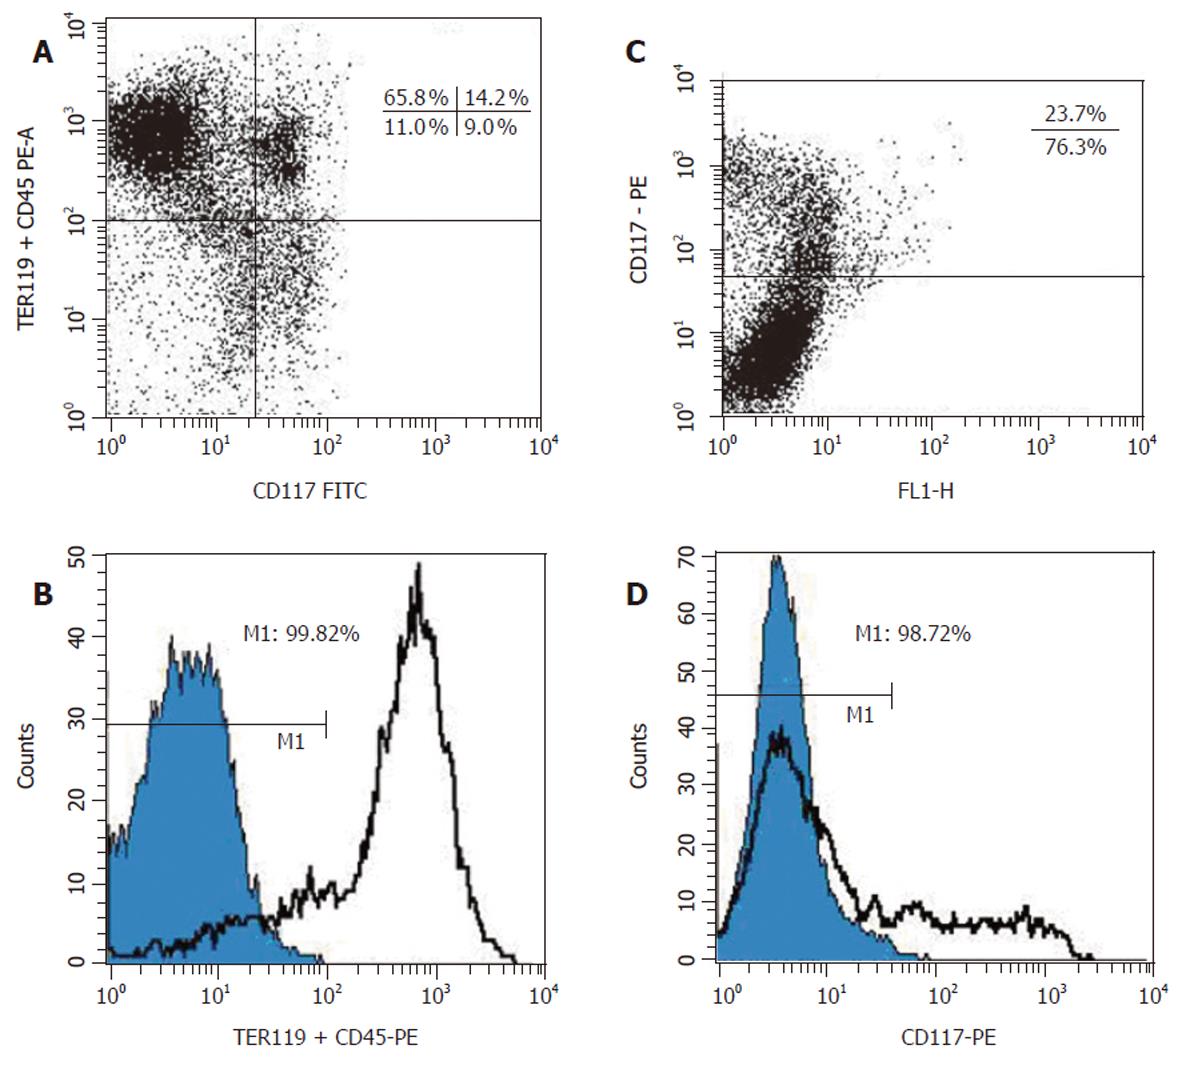
Figure 2 Flow cytometric analysis of fetal mouse liver cells before and after immuno-magnetic sorting.
A: Two-color FACS analysis of ED 13 mouse fetal liver cells by FACSCalibur. Cells were stained as described in Figure 1A. B: Histograms for the immuno-magnetically sorted (CD45/TER119)– cells labeled with phycoerythrin-streptavidin (blue) and the total cell populations before sorting (white). C: FACS analysis of ED 13 mouse fetal liver cells stained with the biotinylated anti-c-Kit mAb. D: Analysis of the immuno-magnetically sorted c-Kit– cells labeled with phycoerythrin-streptavidin (blue). The histogram of Figure 2B is also shown (white).
- Citation: He YF, Liu YK, Gao DM, Chen J, Yang PY. An efficient method of sorting liver stem cells by using immuno-magnetic microbeads. World J Gastroenterol 2006; 12(19): 3050-3054
- URL: https://www.wjgnet.com/1007-9327/full/v12/i19/3050.htm
- DOI: https://dx.doi.org/10.3748/wjg.v12.i19.3050


