Copyright
©2005 Baishideng Publishing Group Inc.
World J Gastroenterol. Mar 7, 2005; 11(9): 1303-1316
Published online Mar 7, 2005. doi: 10.3748/wjg.v11.i9.1303
Published online Mar 7, 2005. doi: 10.3748/wjg.v11.i9.1303
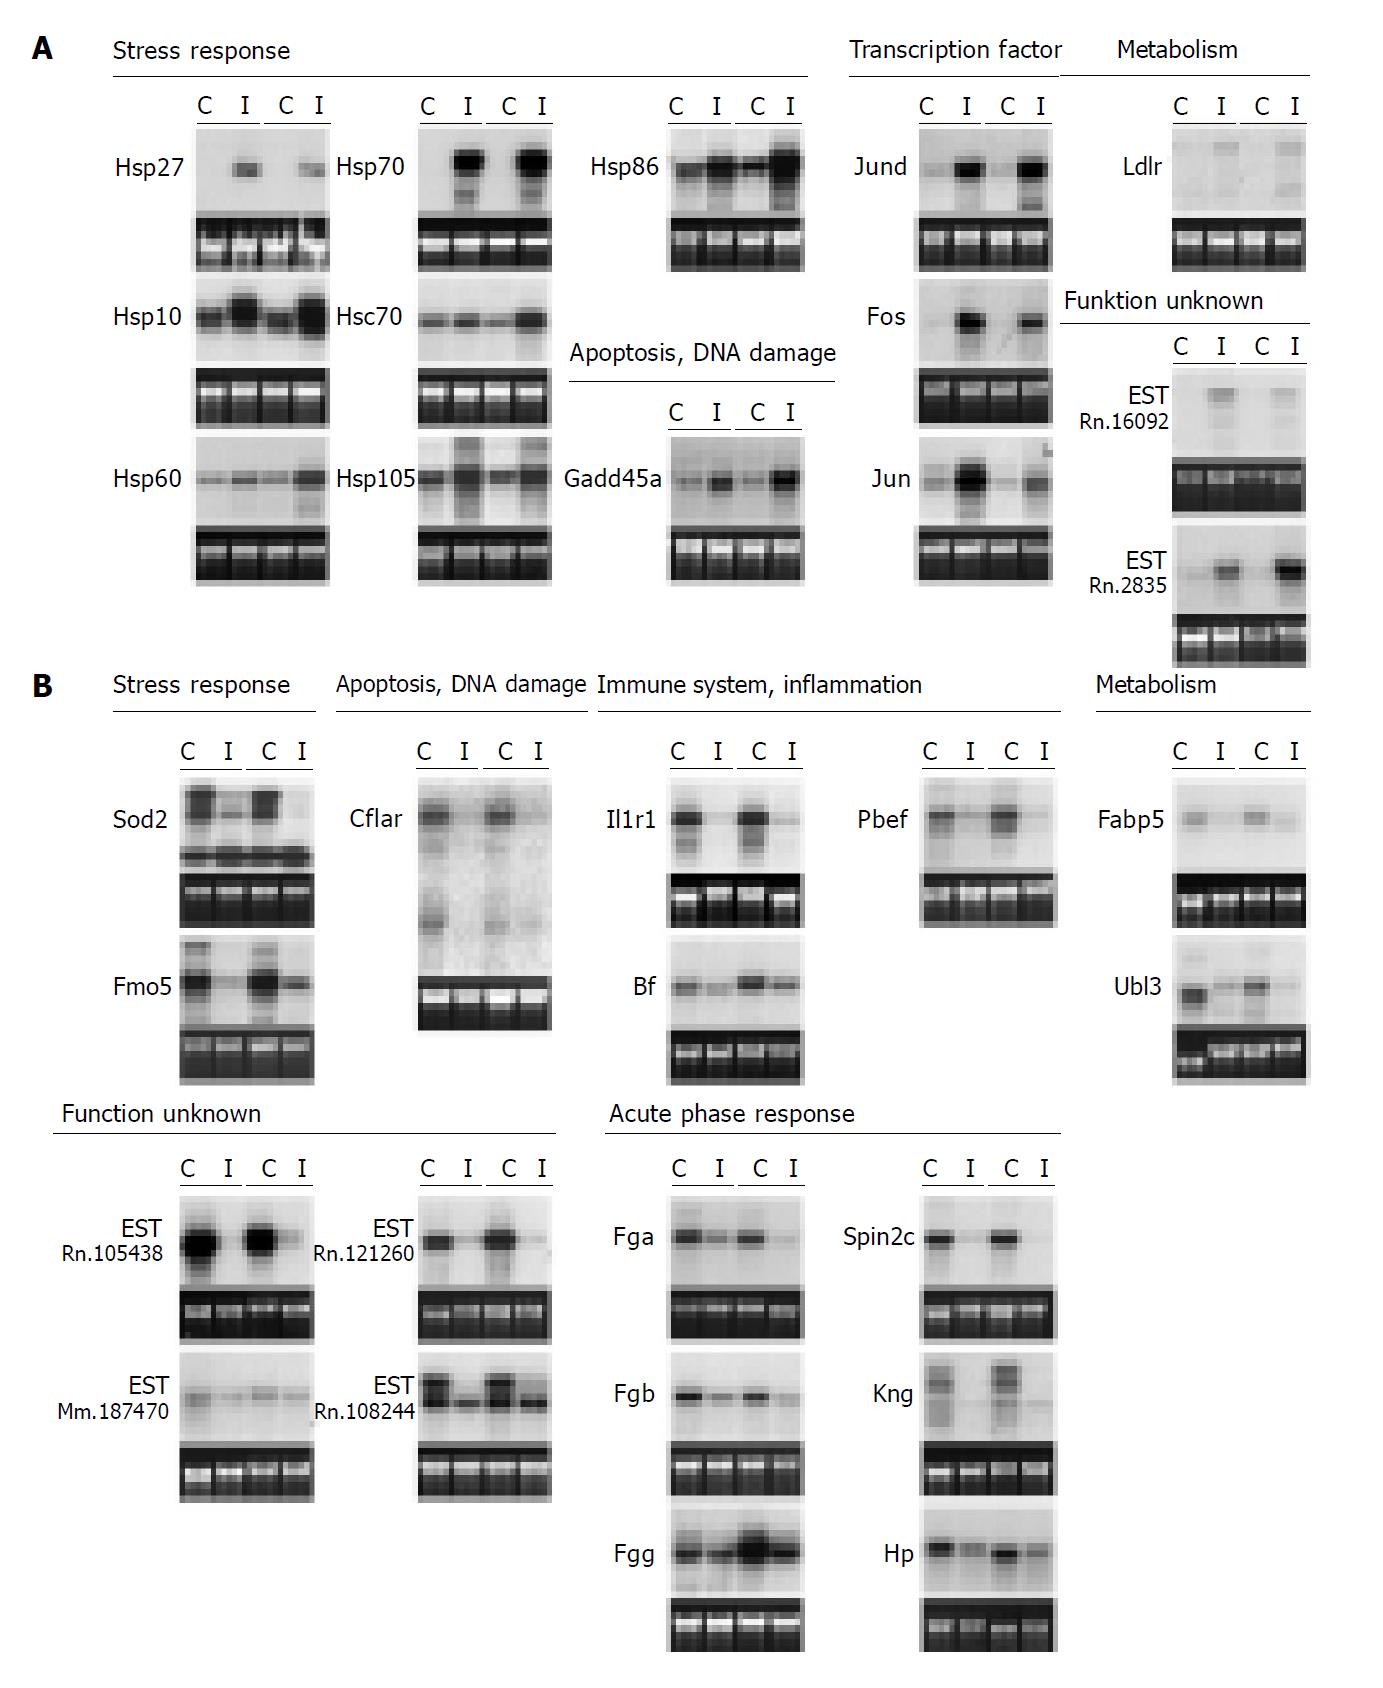
Figure 4 Northern blot data of verified target genes (SSH and ‘Atlas Array’) after partial WI/R (1 h/2 h).
Exemplarily, liver lobes of two animals are shown. Matched liver lobes (C- and I-lobe) are underlined. Abbreviations of the analyzed genes are written on the left of every Northern blot. For full titles see Table 2. 28s rRNA bands of the ethidium bromide-stained gels are shown below the respective blots as loading controls. 14 genes with enriched RNA (A) and 18 down-regulated genes (B) in the I-lobes.
- Citation: Fallsehr C, Zapletal C, Kremer M, Demir R, von Knebel Doeberitz M, Klar E. Identification of differentially expressed genes after partial rat liver ischemia/reperfusion by suppression subtractive hybridization. World J Gastroenterol 2005; 11(9): 1303-1316
- URL: https://www.wjgnet.com/1007-9327/full/v11/i9/1303.htm
- DOI: https://dx.doi.org/10.3748/wjg.v11.i9.1303


