Copyright
©2005 Baishideng Publishing Group Inc.
World J Gastroenterol. Apr 7, 2005; 11(13): 1937-1945
Published online Apr 7, 2005. doi: 10.3748/wjg.v11.i13.1937
Published online Apr 7, 2005. doi: 10.3748/wjg.v11.i13.1937
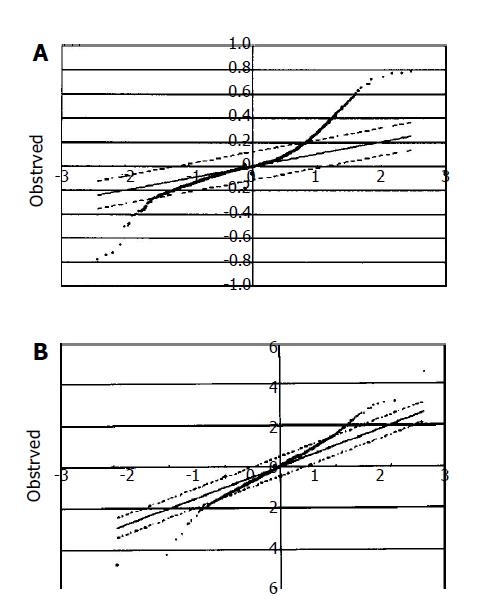
Figure 3 SAM analysis of gastric adenoma/carcinoma microdissected from formalin-fixed biopsies.
A: At the expected false significance rate of 0.15%, 504 up-regulated and 29 down-regulated genes in adenoma/carcinoma vs normal control (Tables 2 and 3); B: At the expected false significance rate of 0.61%, 50 up-regulated and 22 down-regulated genes in carcinomas vs adenomas.
-
Citation: Lee CH, Bang SH, Lee SK, Song KY, Lee IC. Gene expression profiling reveals sequential changes in gastric tubular adenoma and carcinoma
in situ . World J Gastroenterol 2005; 11(13): 1937-1945 - URL: https://www.wjgnet.com/1007-9327/full/v11/i13/1937.htm
- DOI: https://dx.doi.org/10.3748/wjg.v11.i13.1937


