Copyright
©The Author(s) 2023.
World J Gastroenterol. Nov 21, 2023; 29(43): 5848-5864
Published online Nov 21, 2023. doi: 10.3748/wjg.v29.i43.5848
Published online Nov 21, 2023. doi: 10.3748/wjg.v29.i43.5848
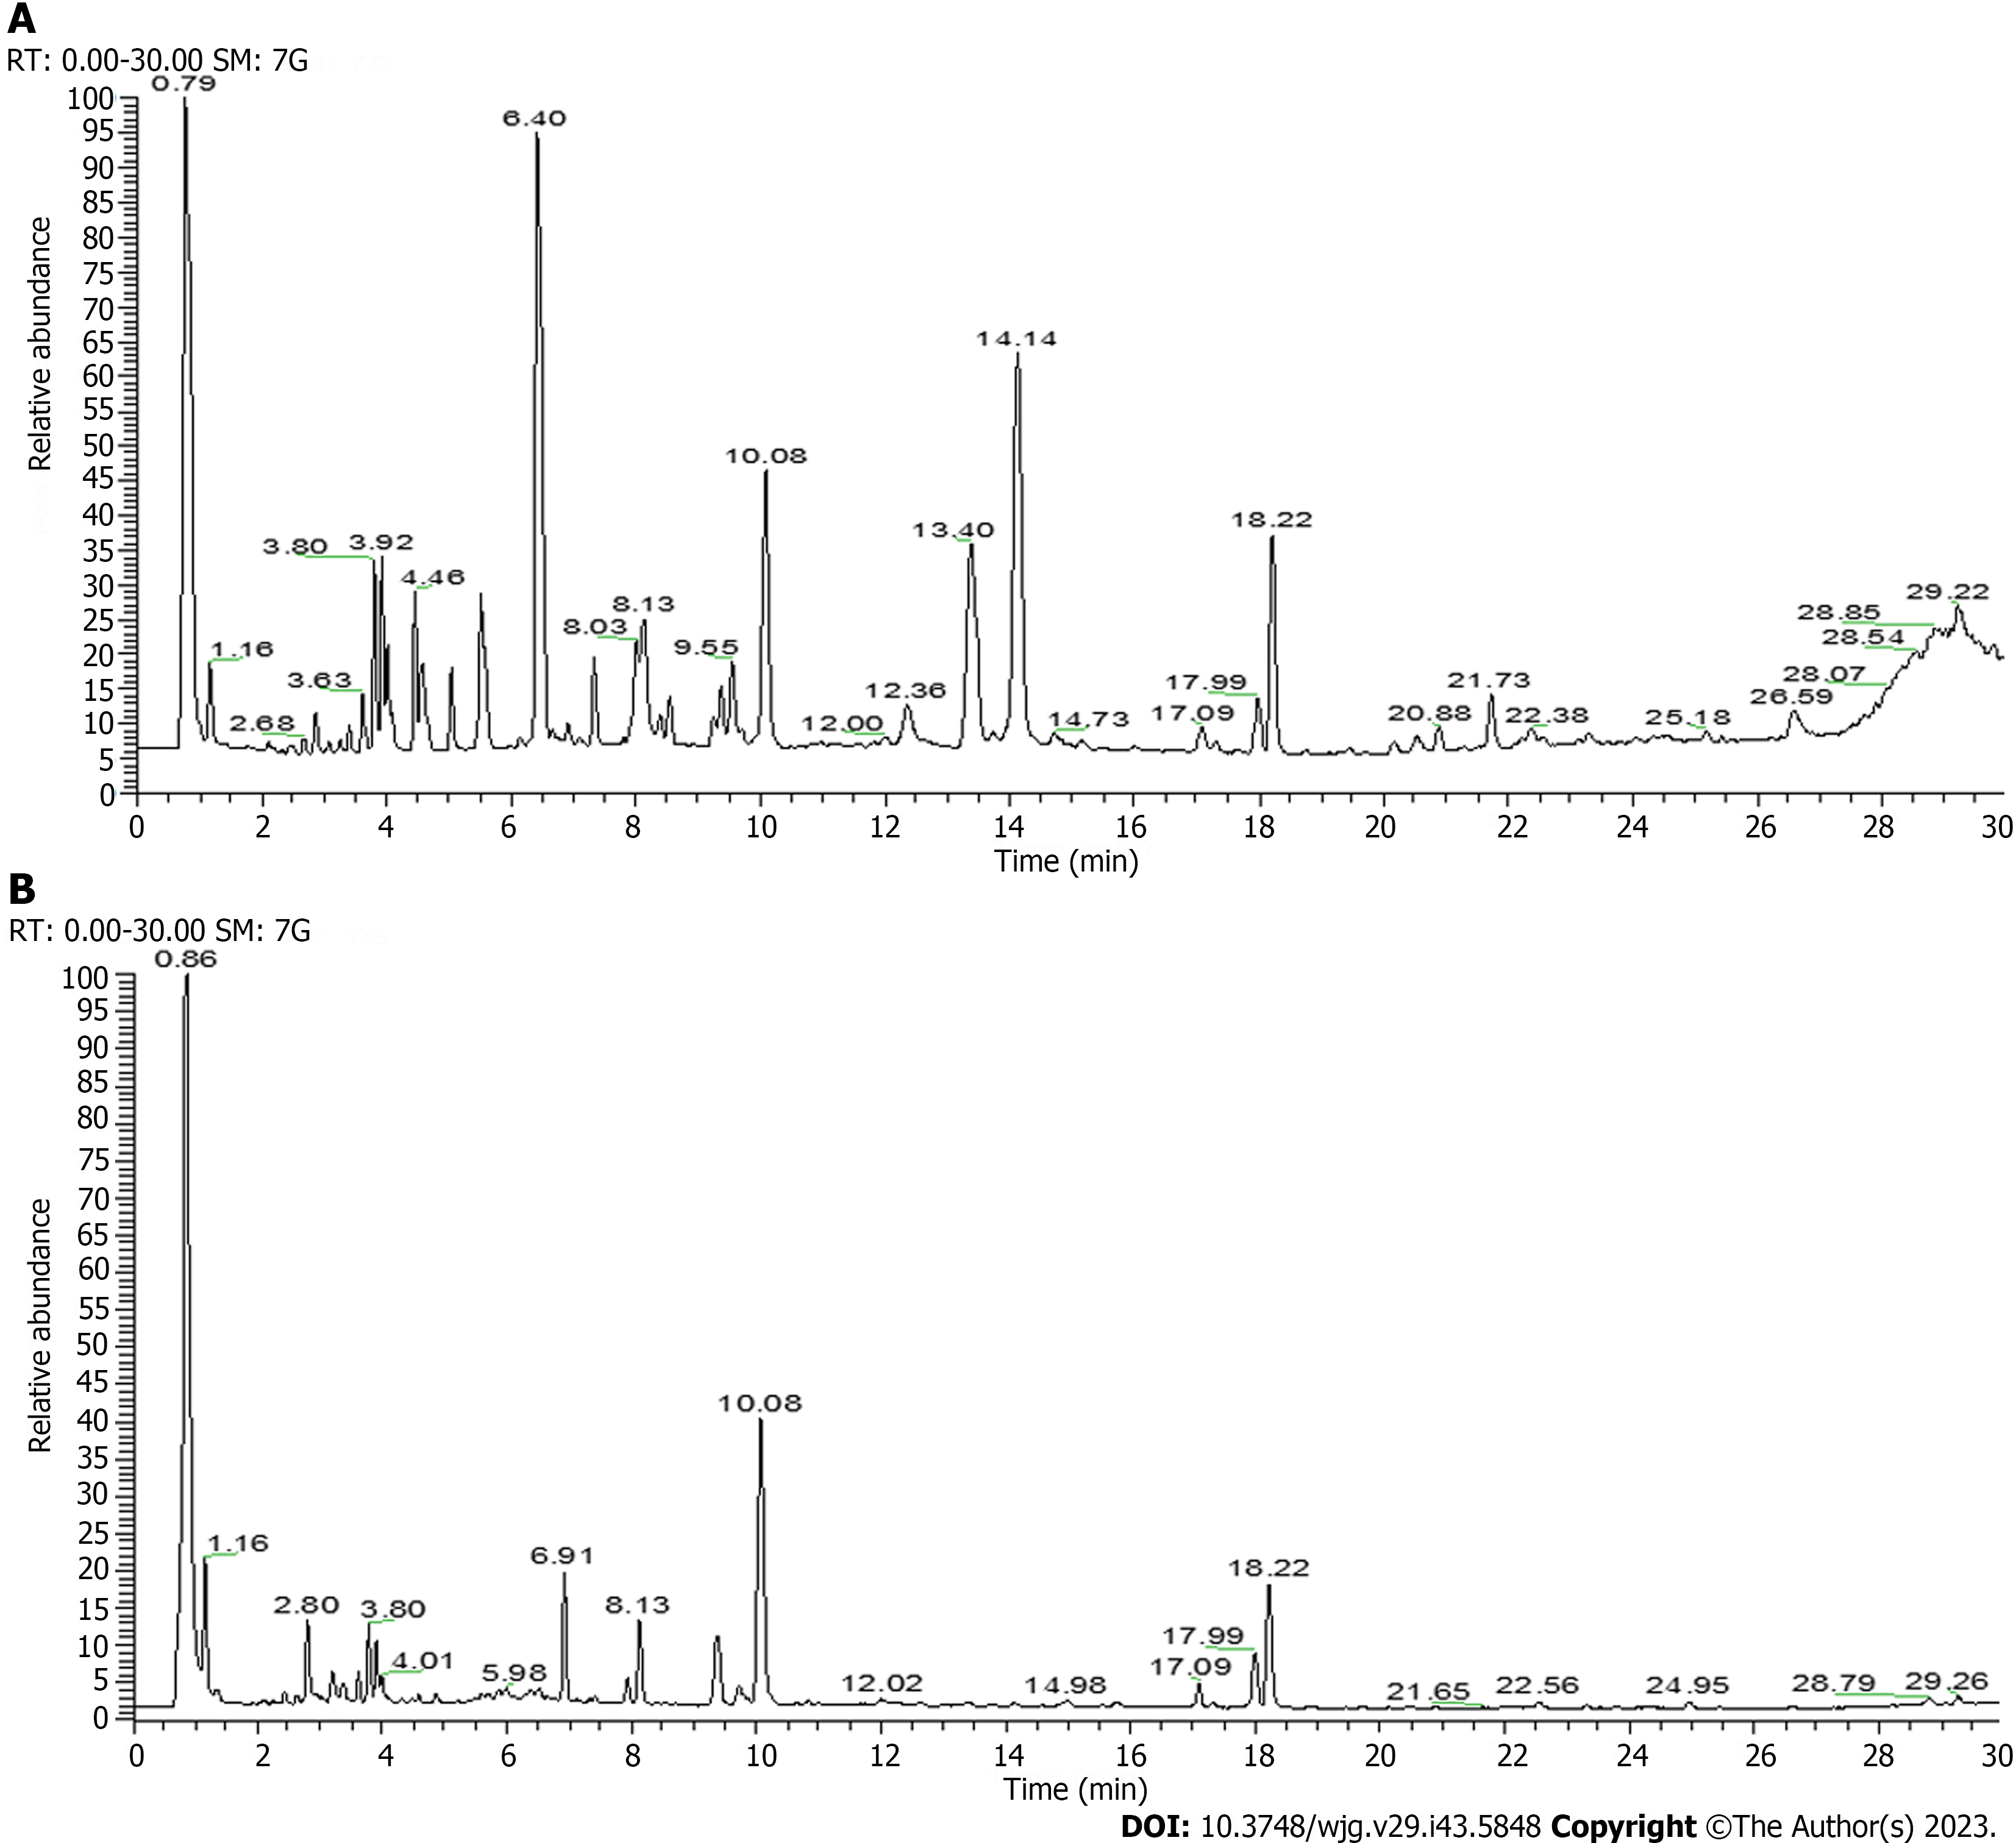
Figure 1 Total ion current chromatogram of Atractylodesjaponica by liquid chromatography-tandem mass spectrometry.
A: Positive ion mode; B: Negative ion mode.
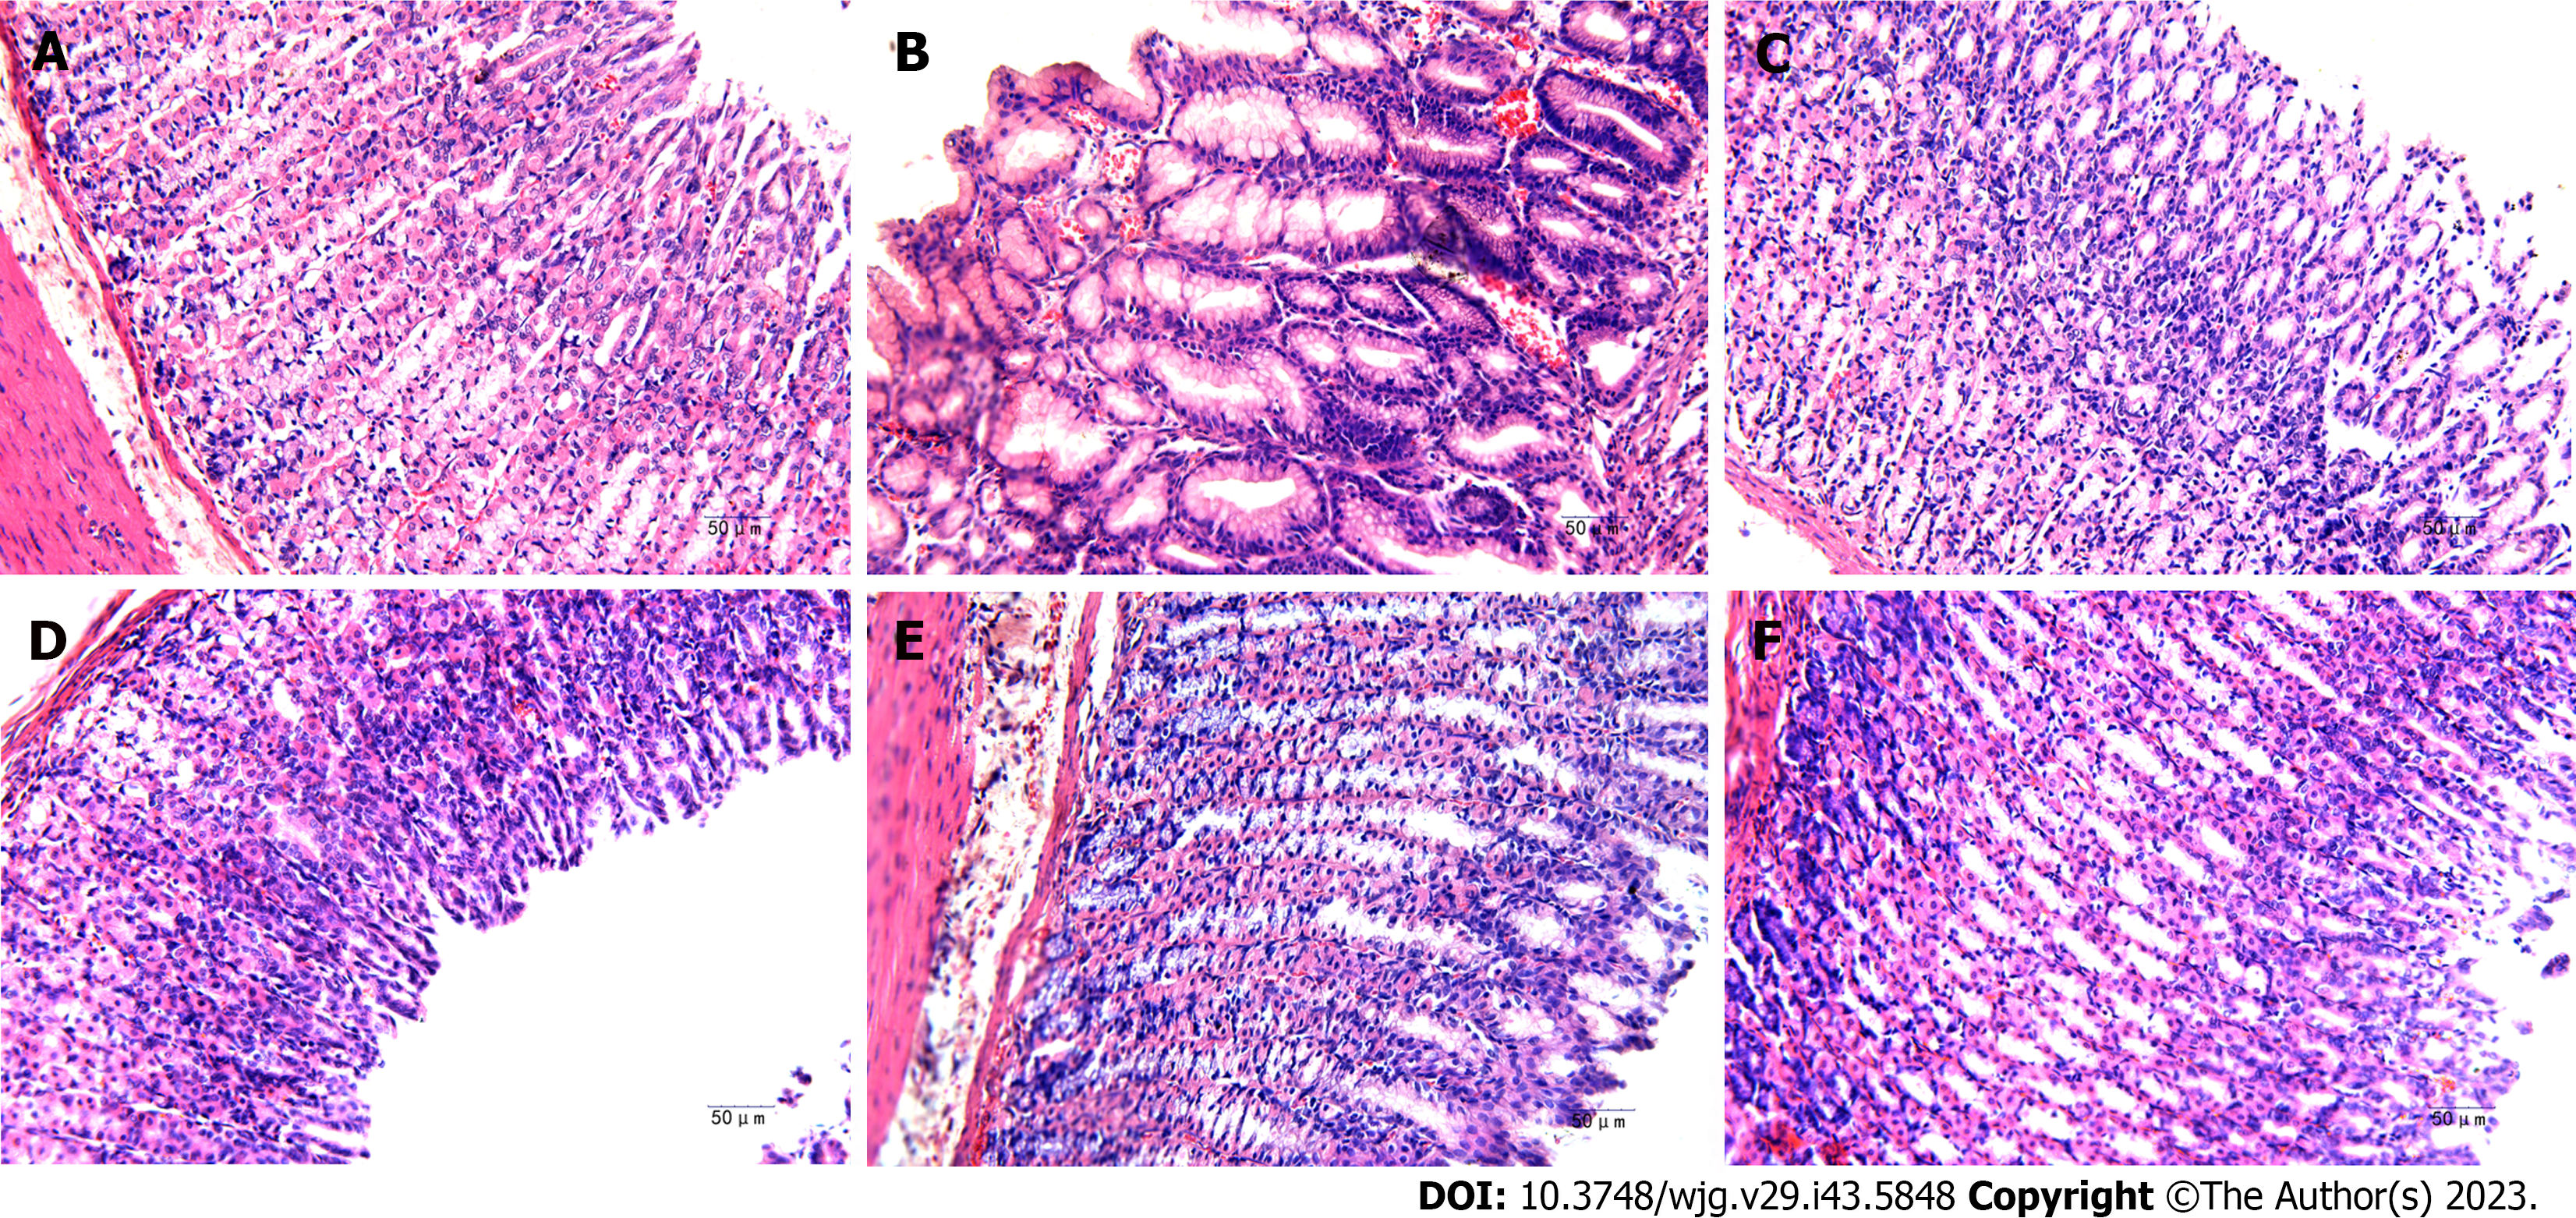
Figure 2 Effect of Atractylodesjaponica on pathological changes of gastric tissues in gastric ulcer rats after 10 d of treatment (n = 8).
A-F: Histological analysis was performed by hematoxylin and eosin staining (200 × original magnification, scale bar 50 μm). Normal group (A); acetic acid-induced model group (B); omeprazole group (C); low dose group of Atractylodes japonica (A. japonicaI) (D); middle dose group of A. japonica (E); high dose group of A. japonica (F).
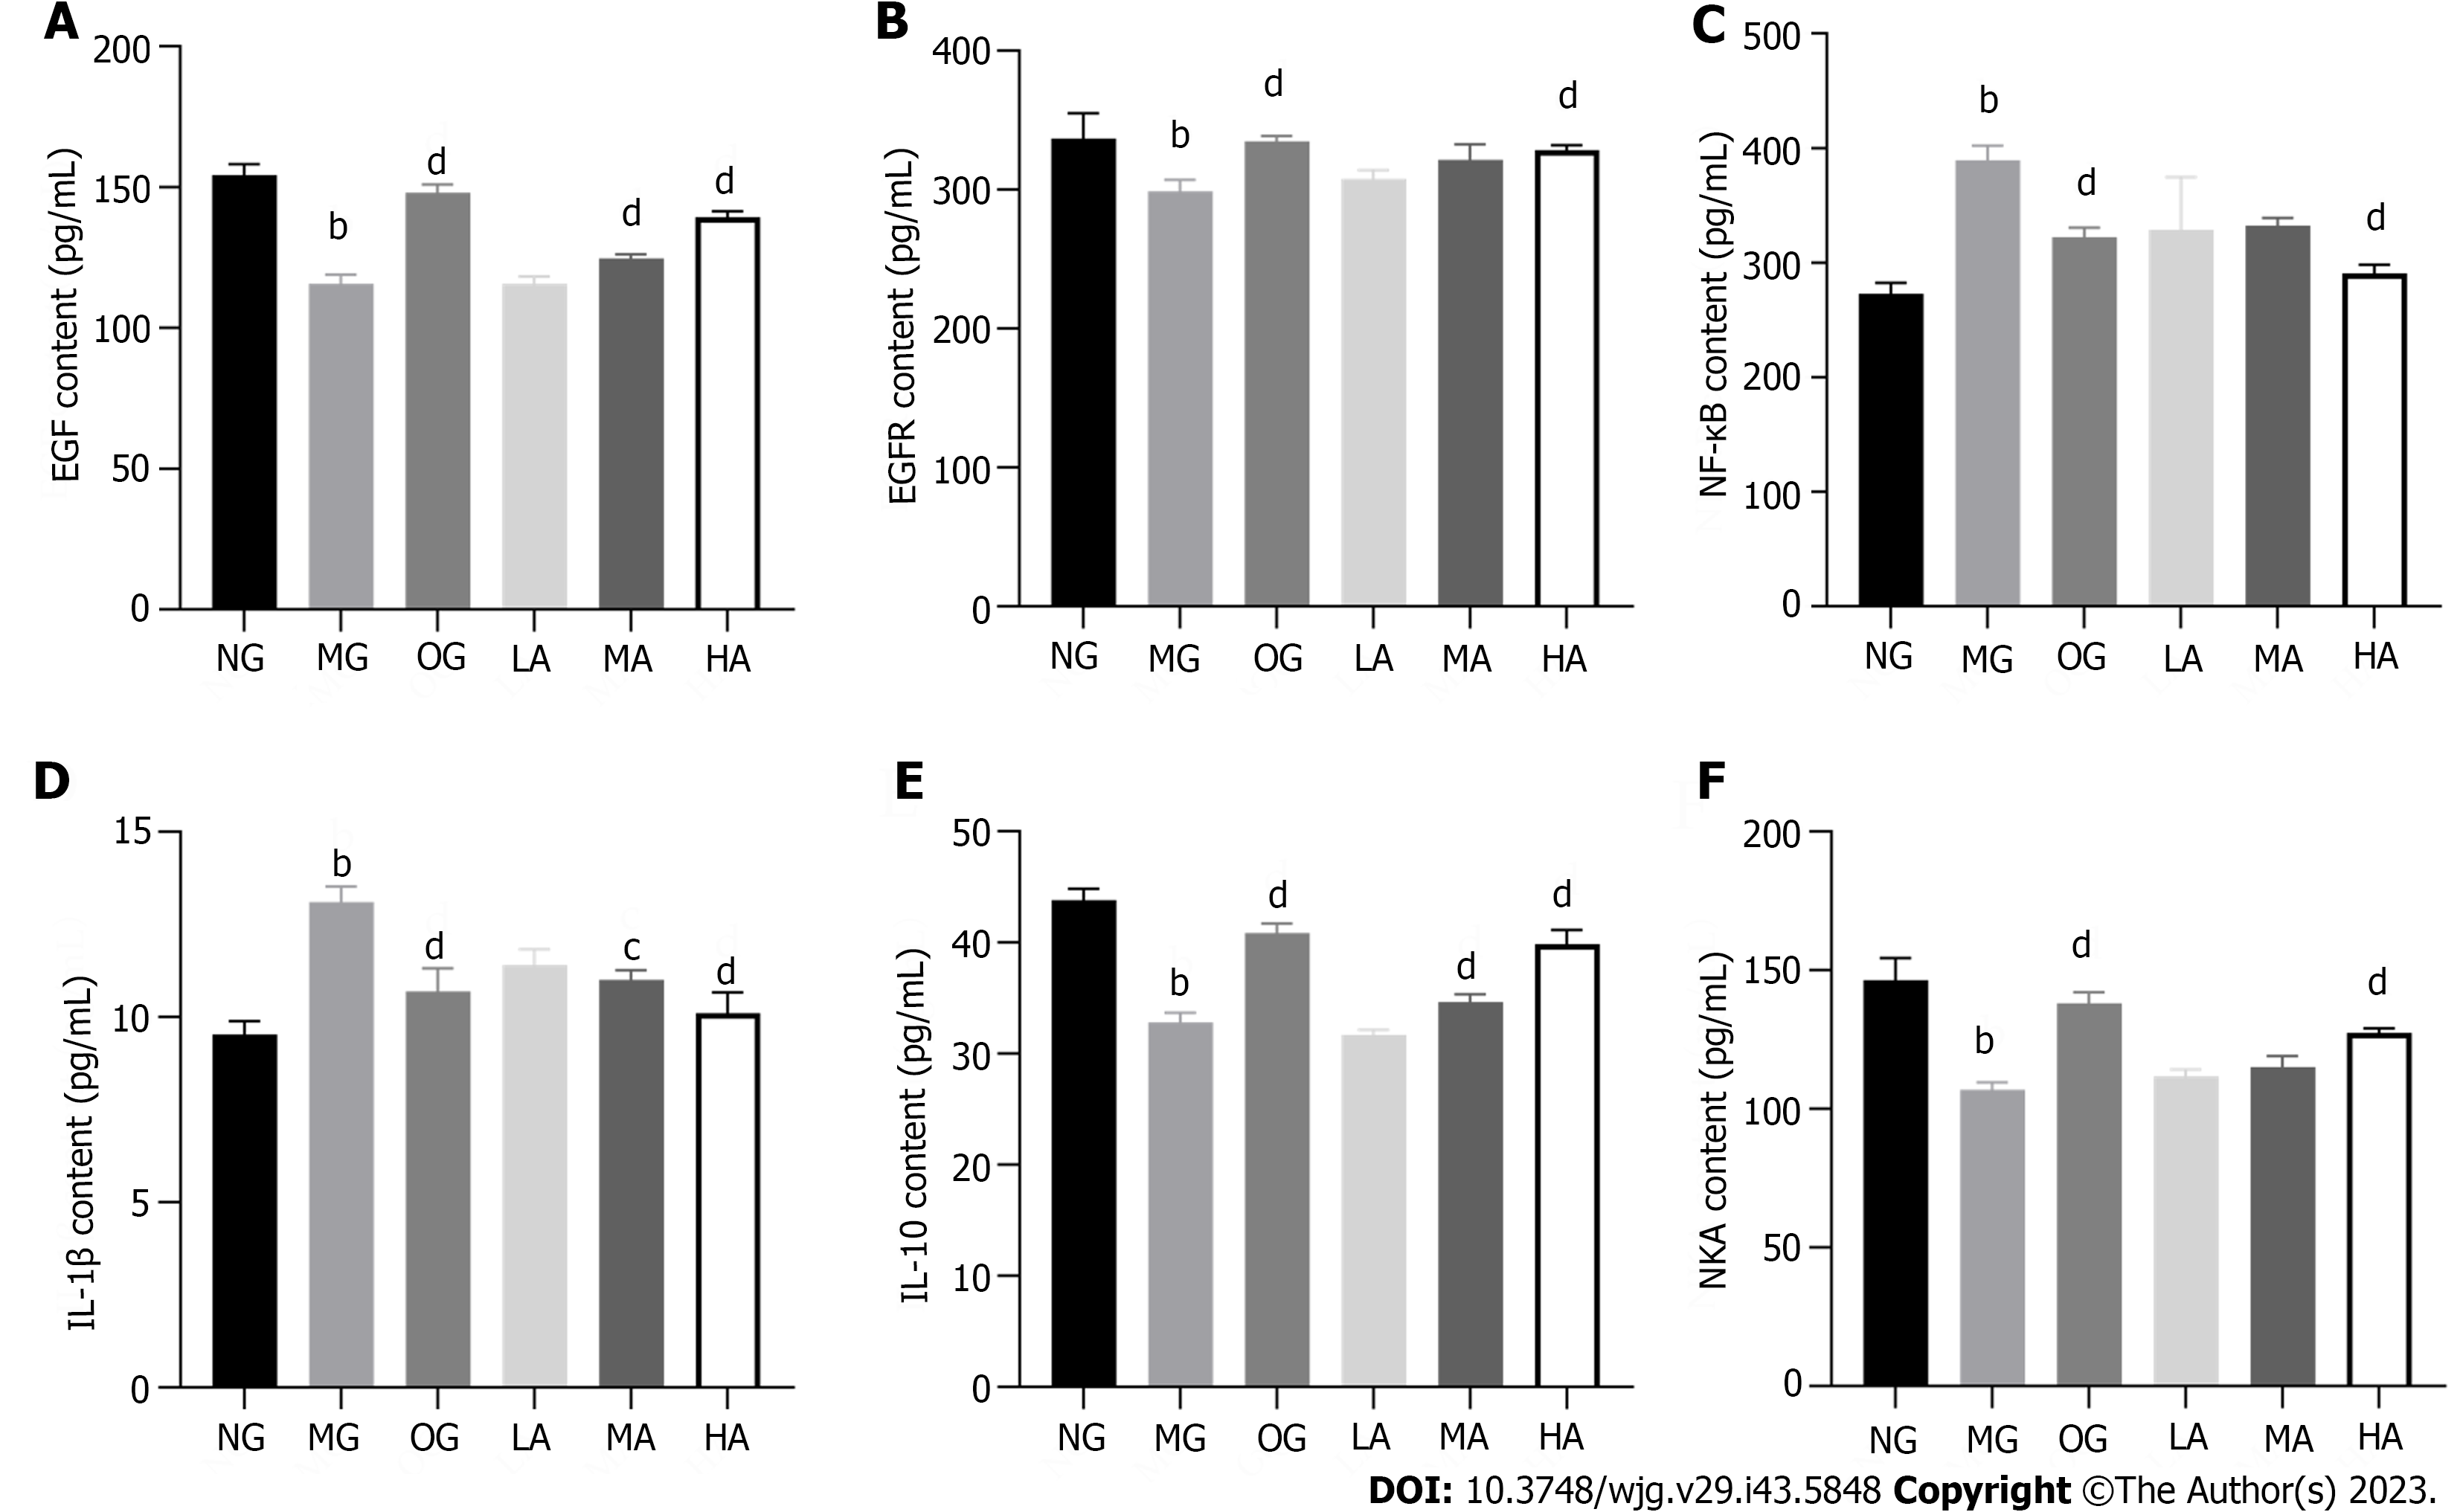
Figure 3 Effect of Atractylodesjaponica on gastric ulcer-associated factors level in serum of gastric ulcer rats (n = 8).
A-F: The epidermal growth factor (EGF), EGF receptor, nuclear factor kappa-B, interleukin-1β (IL-1β), IL-10, and Na+-K+-ATPase levels were detected by enzyme-linked immunosorbent assay in serum of gastric ulcer rats. bP < 0.01 vs normal group; cP < 0.05 and dP < 0.01 vs model group. EGF: Epidermal growth factor; EGFR: Epidermal growth factor receptor; NF-κB: Nuclear factor kappa-B; IL: Interleukin; NKA: Na+-K+-ATPase; NG: Normal group; MG: Model group; OG: Omeprazole group; LA: Low dose group of Atractylodes japonica; MA: Middle dose group of Atractylodes japonica; HA: High dose group of Atractylodes japonica.
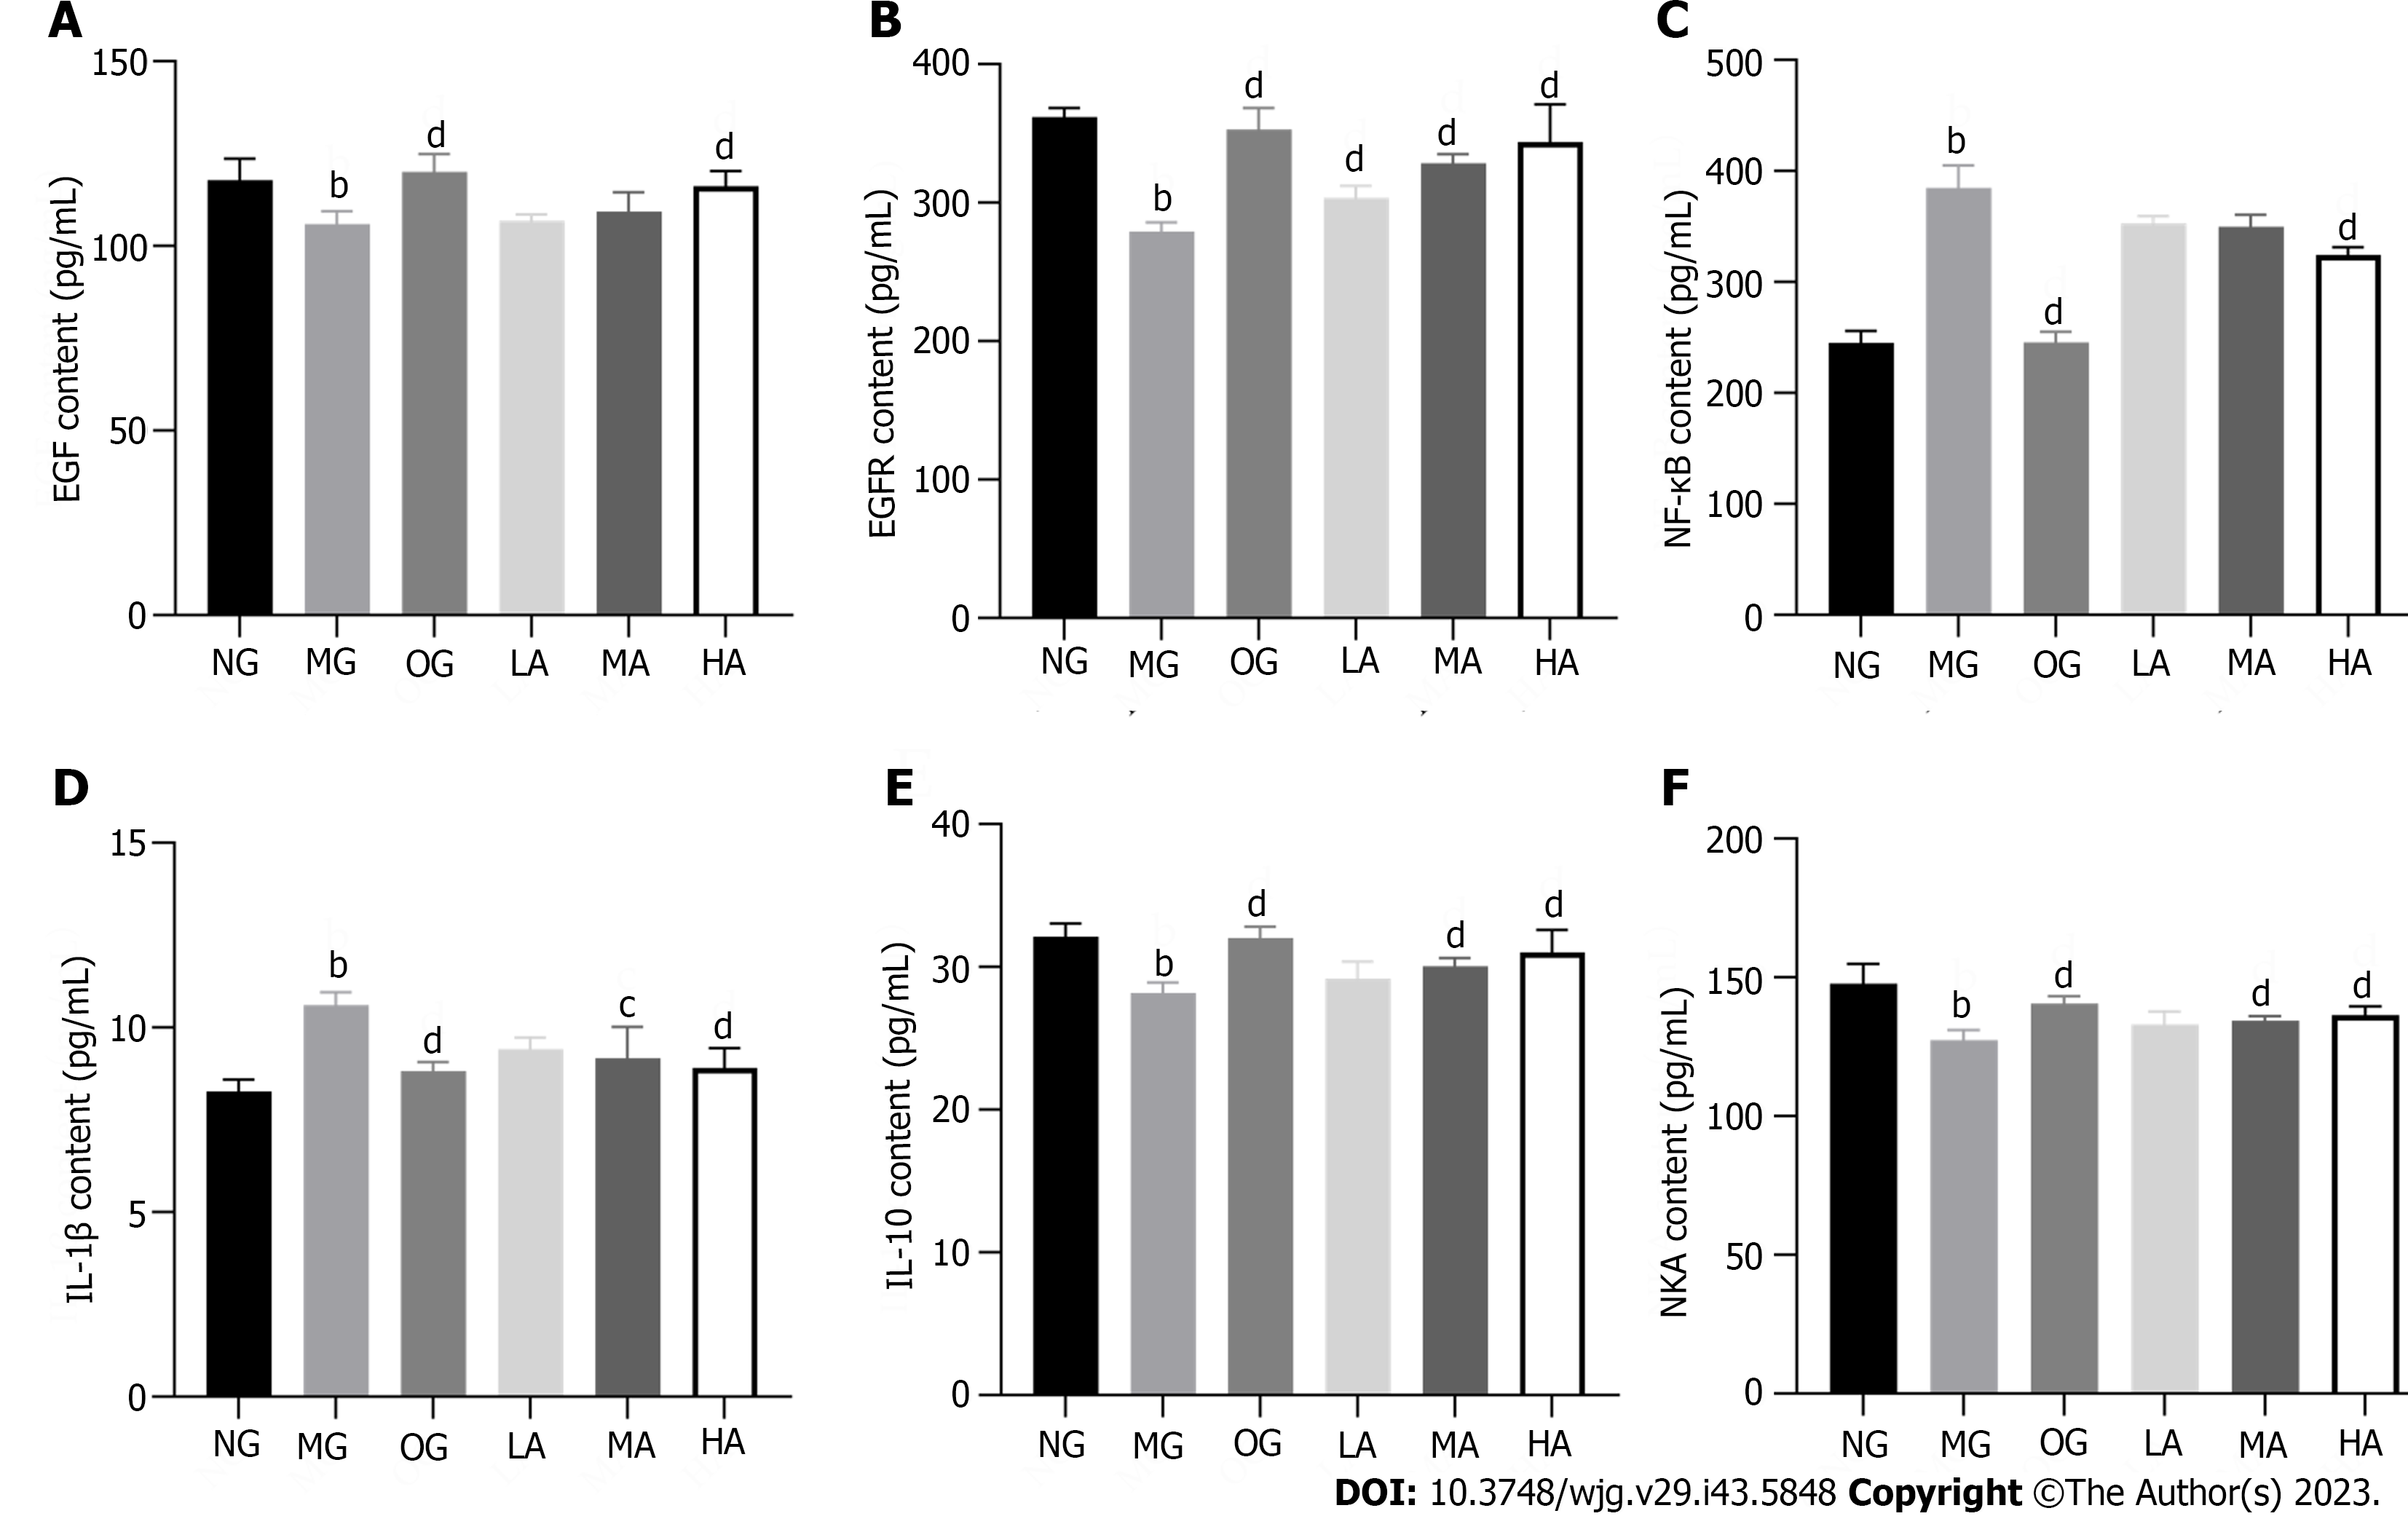
Figure 4 Effect of Atractylodesjaponica on gastric ulcer-associated factors level in gastric tissues of gastric ulcer rats (n = 8).
A-F: The epidermal growth factor (EGF), EGF receptor, nuclear factor kappa-B, interleukin-1β (IL-1β), IL-10, and Na+-K+-ATPase levels were detected by enzyme-linked immunosorbent assay in gastric tissues of gastric ulcer rats. bP < 0.01 vs normal group; cP < 0.05 and dP < 0.01 vs model group. EGF: Epidermal growth factor; EGFR: Epidermal growth factor receptor; NF-κB: Nuclear factor kappa-B; IL: Interleukin; NKA: Na+-K+-ATPase; NG: Normal group; MG: Model group; OG: Omeprazole group; LA: Low dose group of Atractylodes japonica; MA: Middle dose group of Atractylodes japonica; HA: High dose group of Atractylodes japonica.
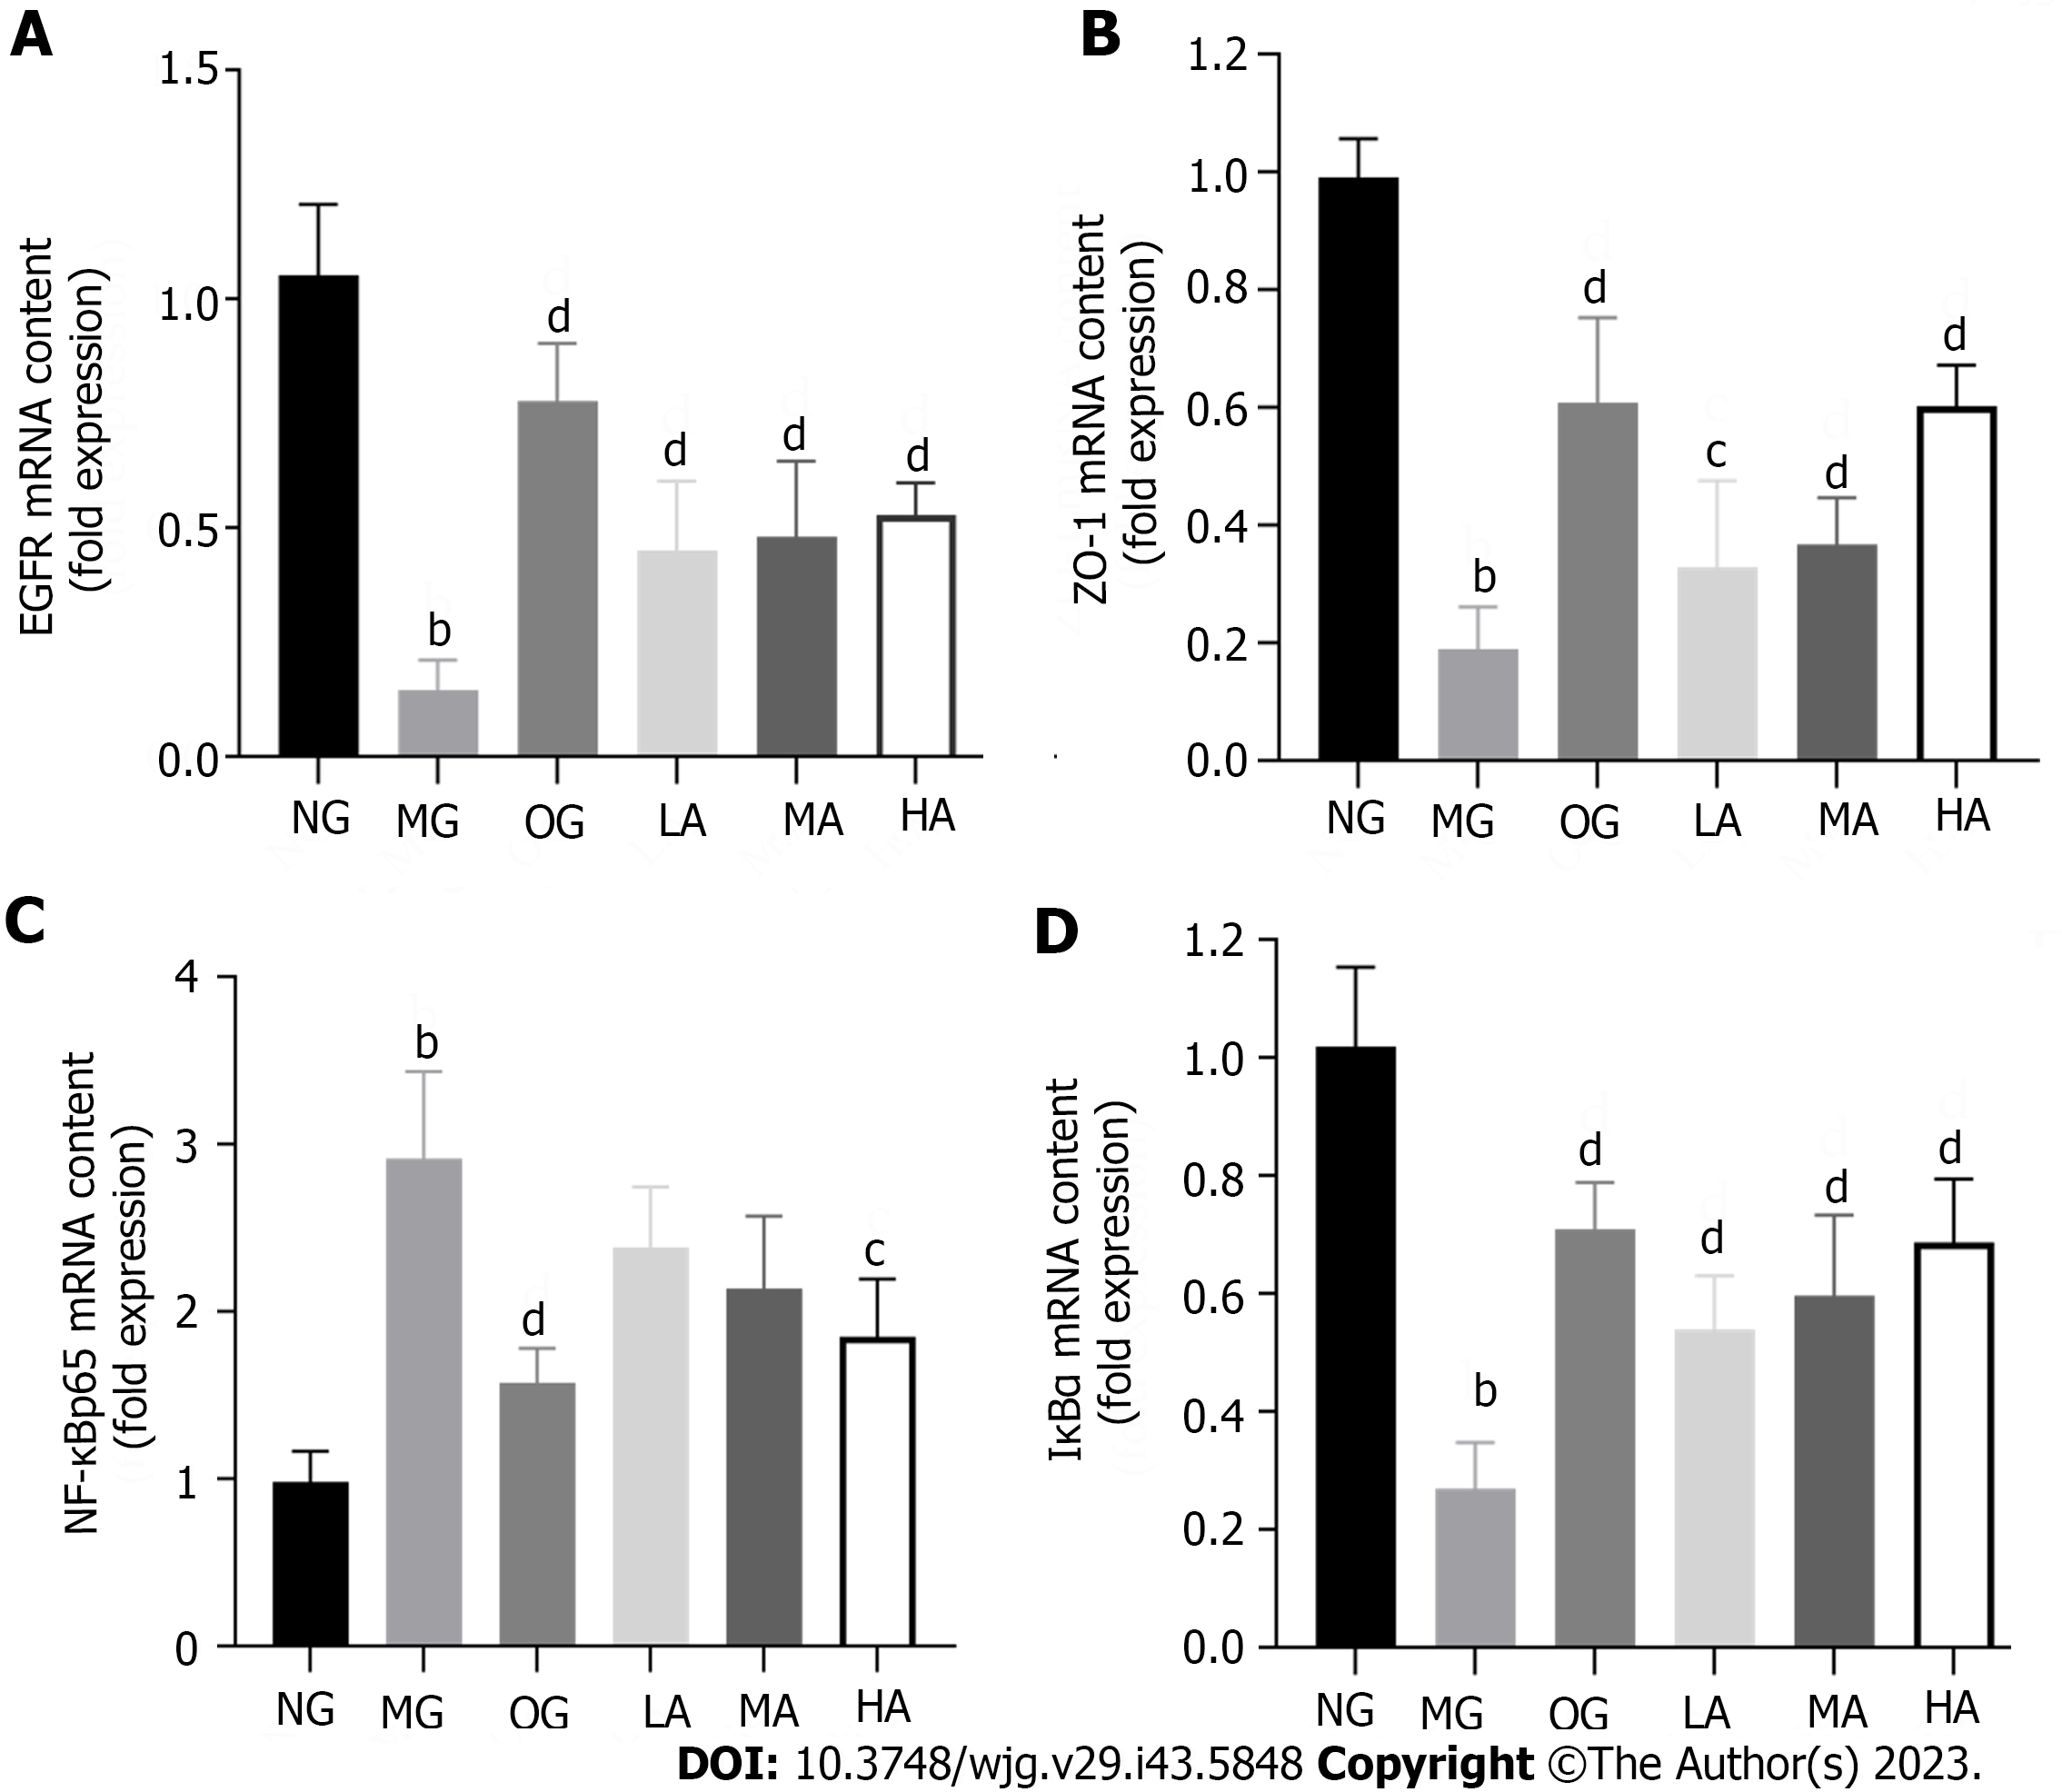
Figure 5 Effect of Atractylodesjaponica on gastric ulcer-associated genes in acid-induced gastric tissues (n = 8).
A-D: The mRNA levels of epidermal growth factor receptor, Zonula Occludens-1, nuclear factor kappa-B p65, IkappaBalpha in gastric tissues were analysed by real-time reverse transcription polymerase chain reaction. bP < 0.01 vs normal group; cP < 0.05 and dP < 0.01 vs model group. EGFR: Epidermal growth factor receptor; ZO-1: Zonula Occludens-1; NF-κB: Nuclear factor kappa-B; IκBα: IkappaBalpha; NG: Normal group; MG: Model group; OG: Omeprazole group; LA: Low dose group of Atractylodes japonica; MA: Middle dose group of Atractylodes japonica; HA: High dose group of Atractylodes japonica.
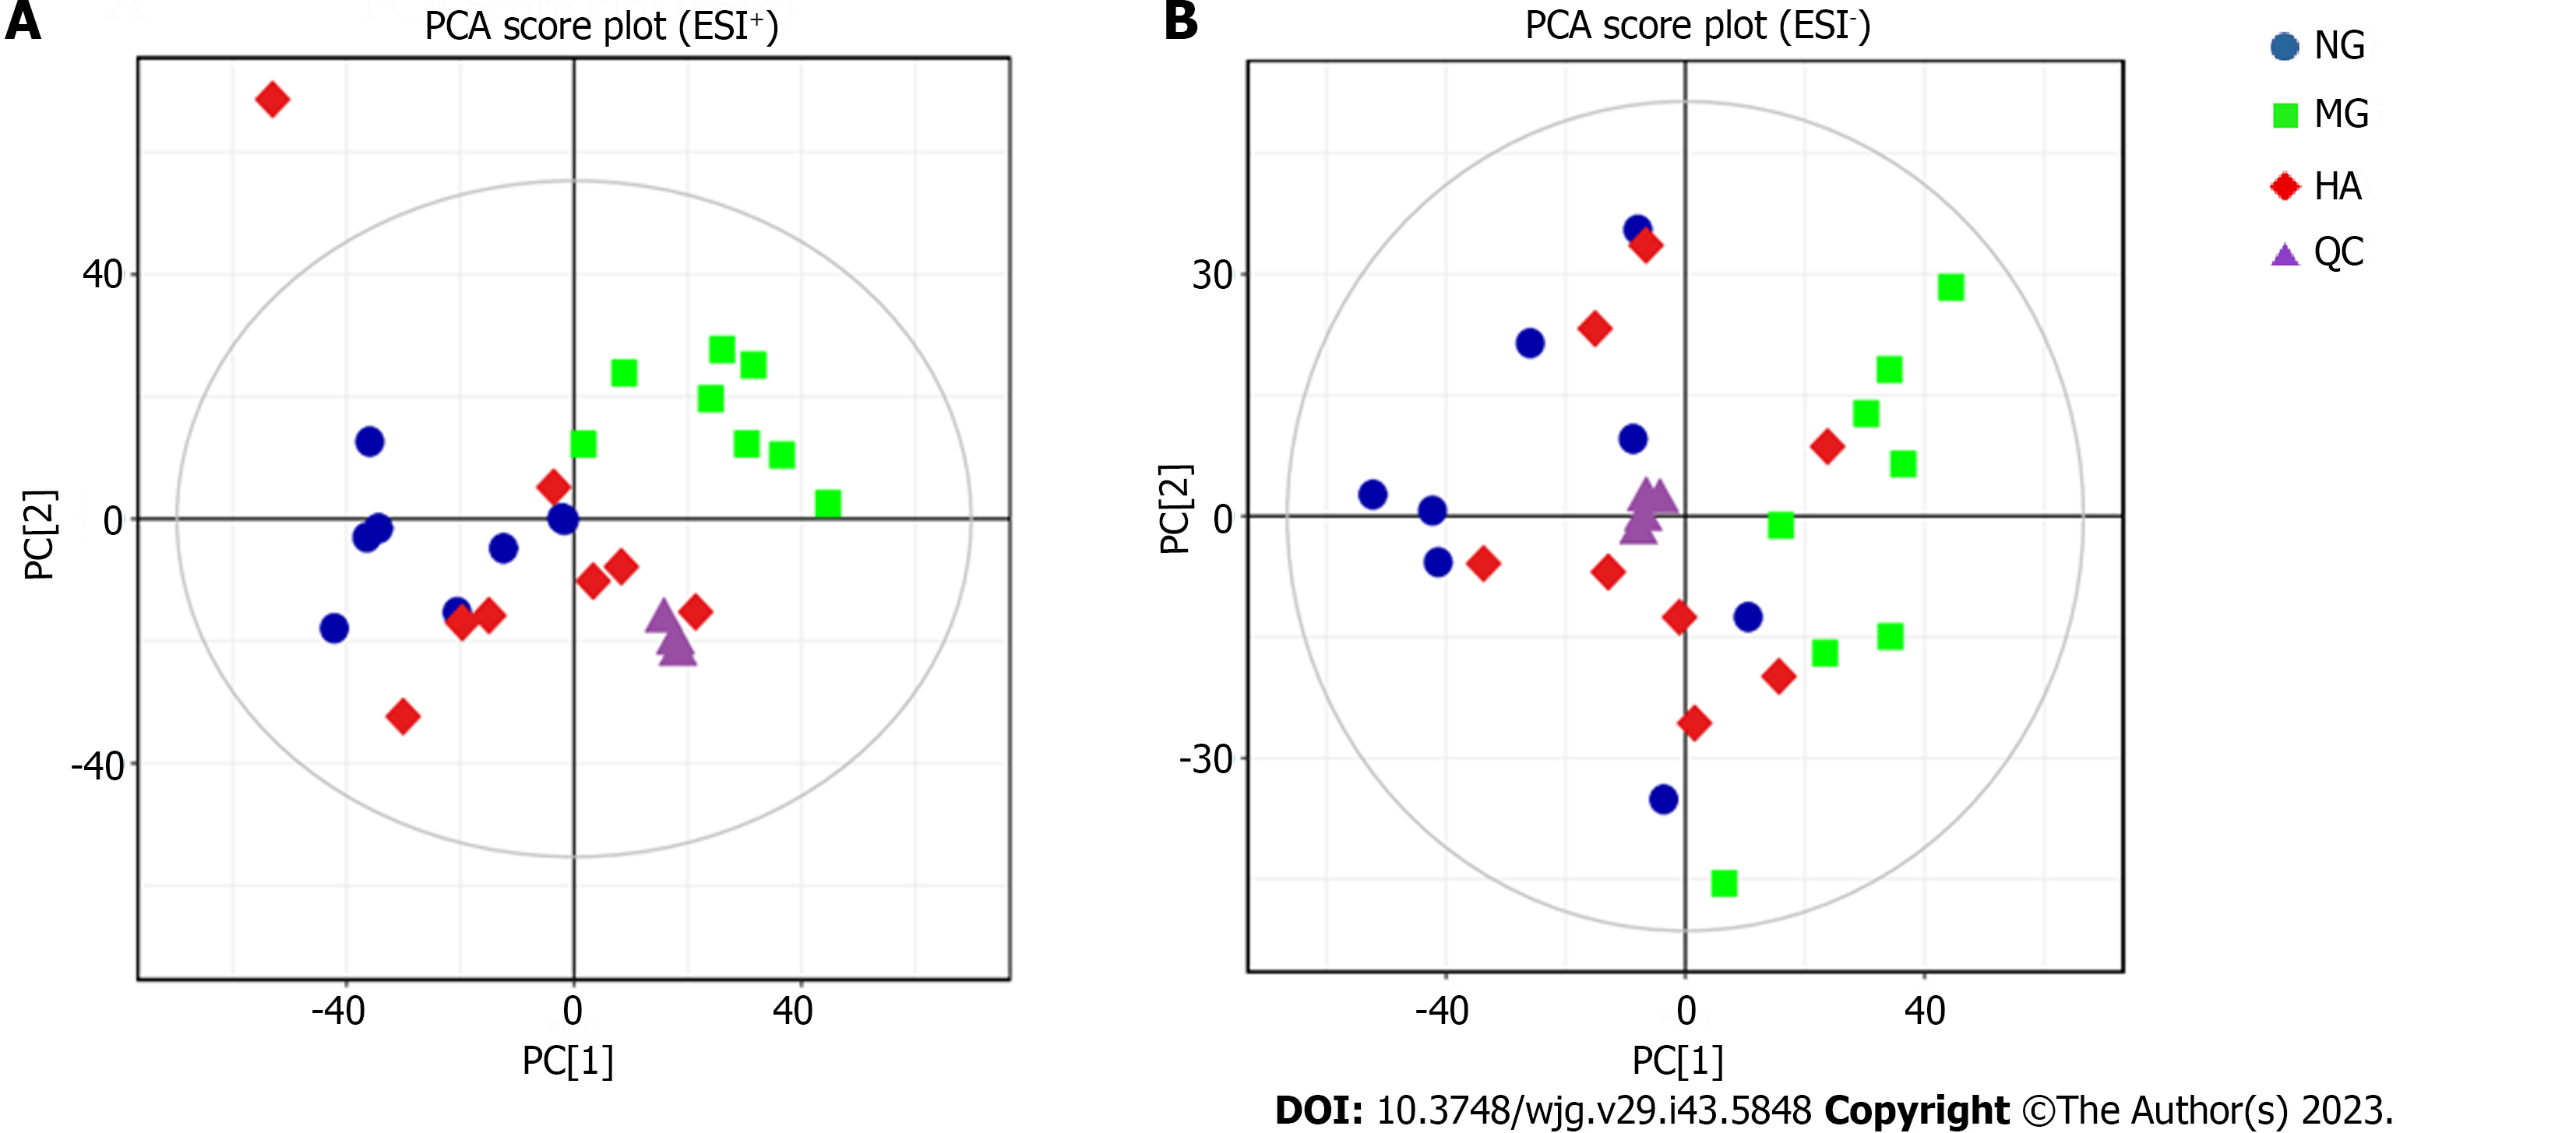
Figure 6 Principal component analysis score plots of plasma metabolomics analysis (n = 8).
Principal component analysis score plots among normal group, model group, high dose group of Atractylodes japonica and quality control groups. A: Positive ion mode(ESI+); B: Negative ion mode(ESI-). PCA: Principal component analysis; NG: Normal group; MG: Model group; HA: High dose group of Atractylodes japonica; QC: Quality control.
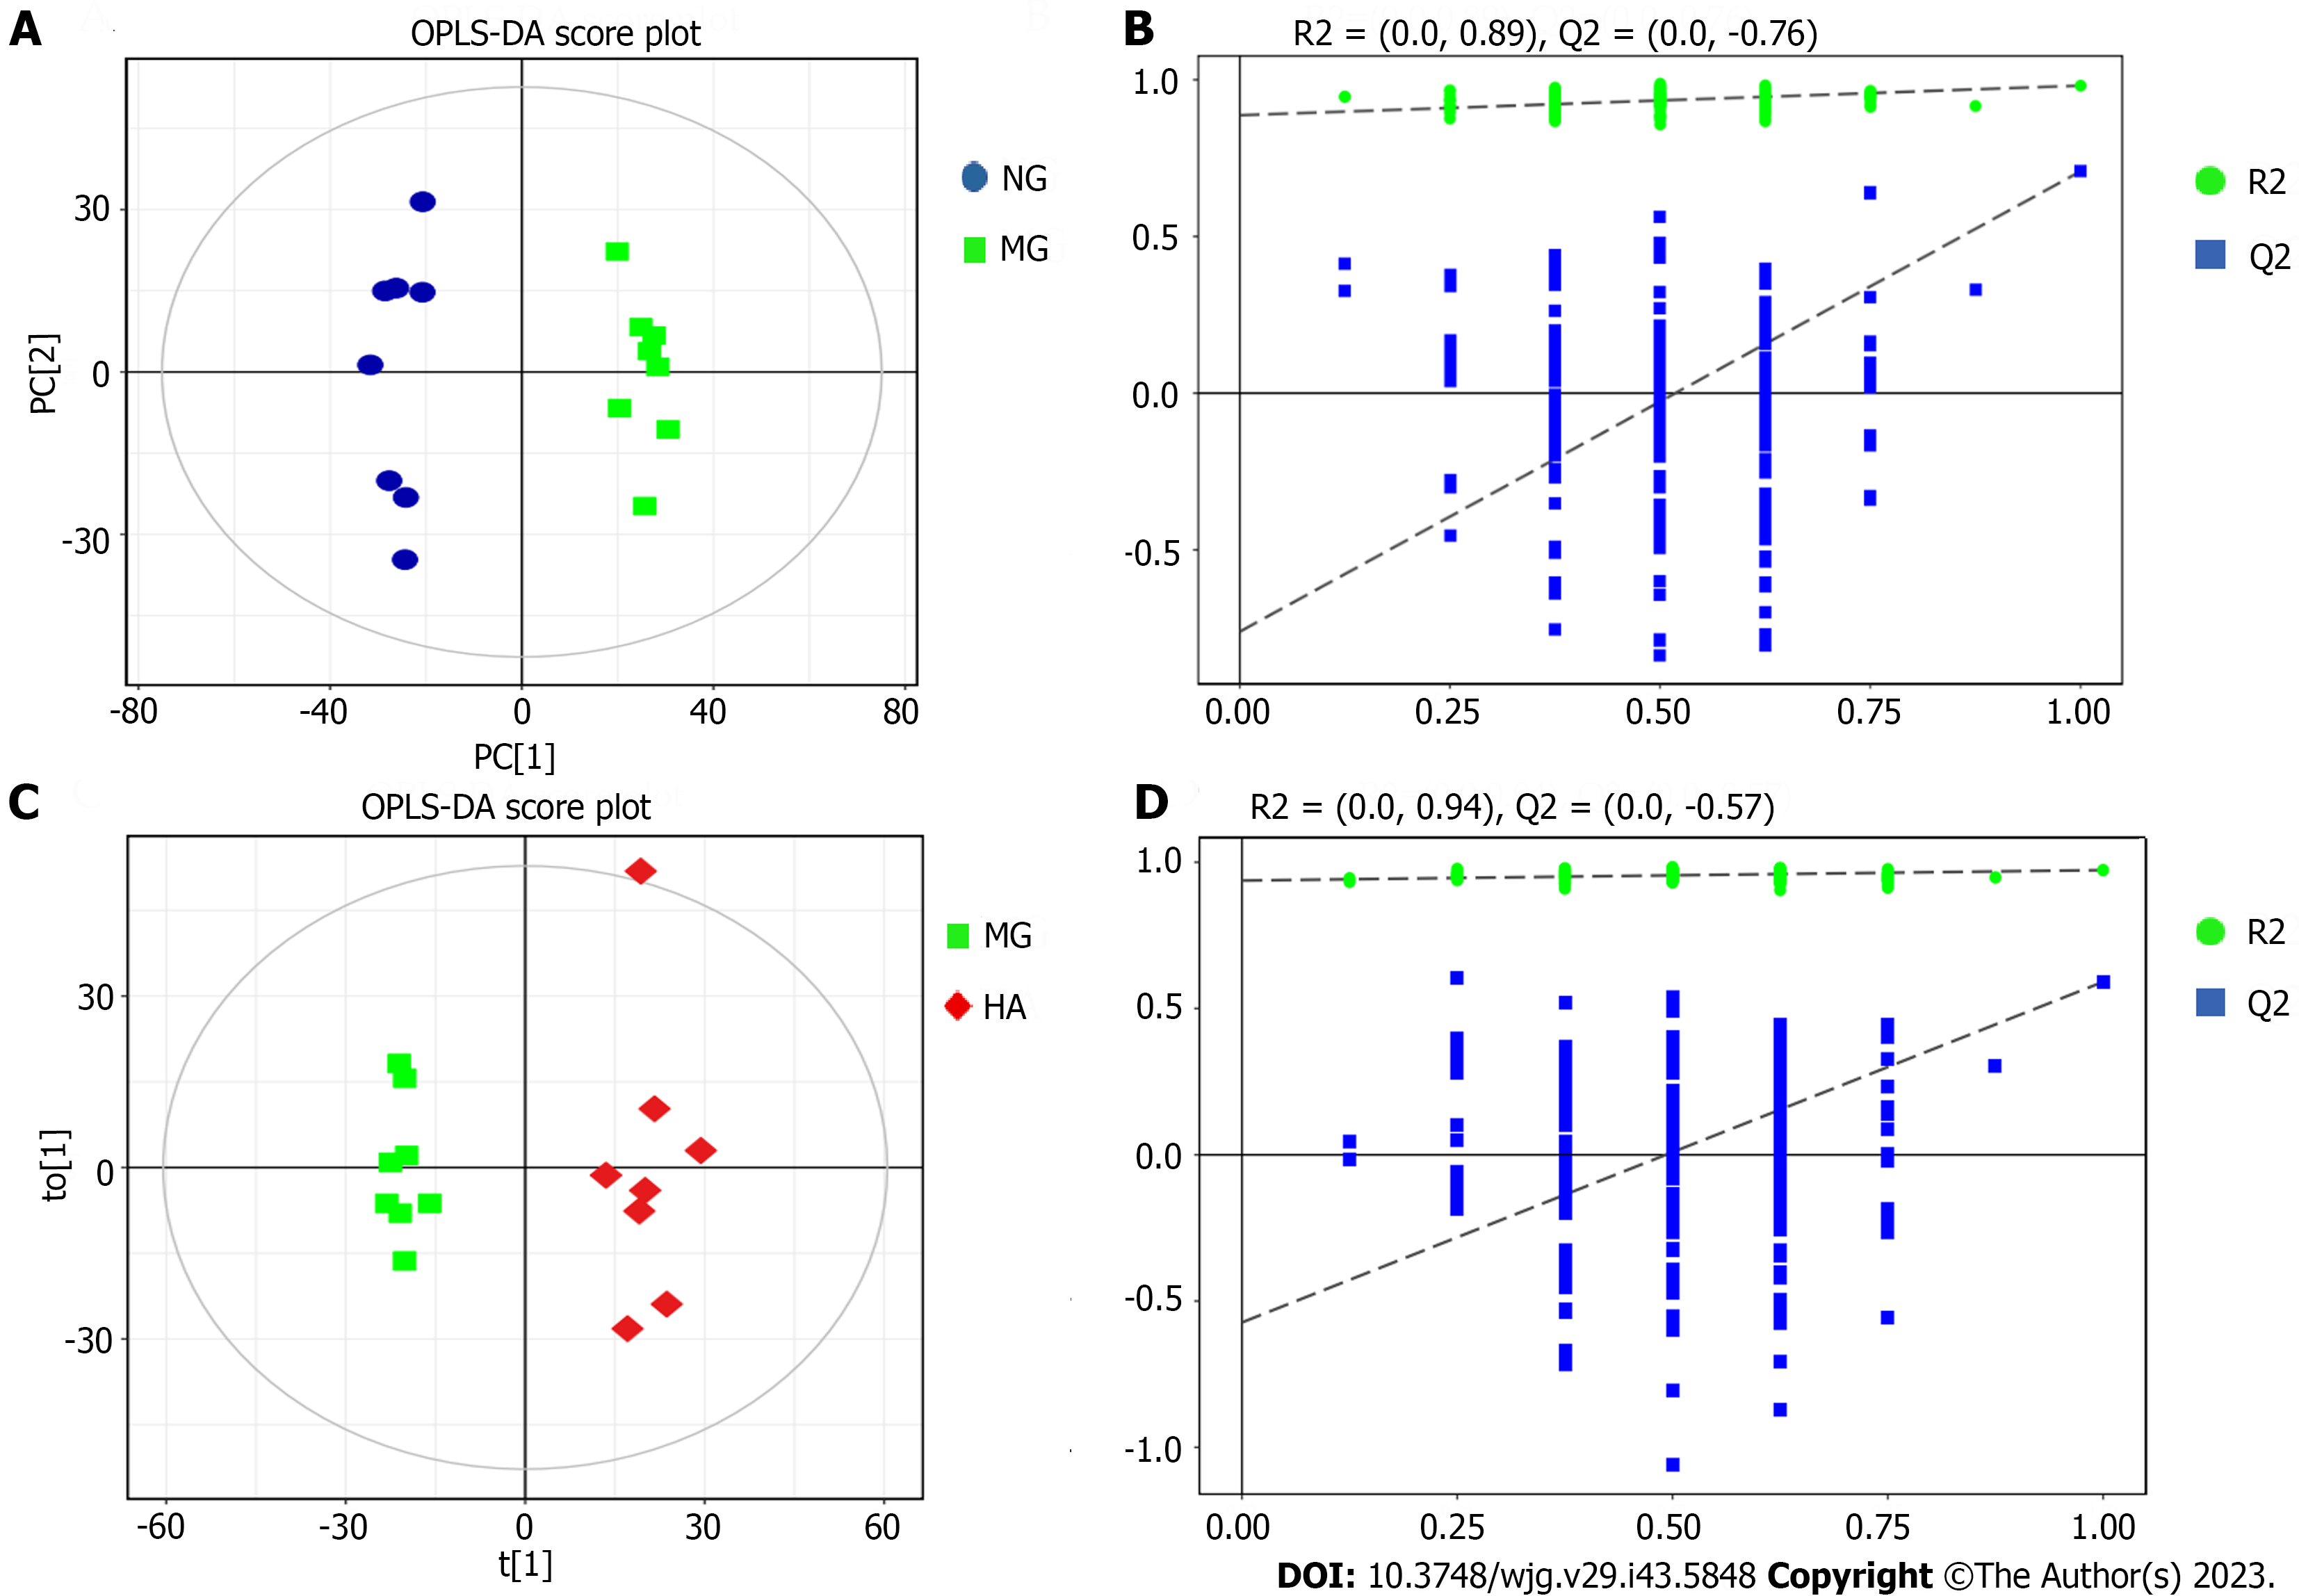
Figure 7 Orthogonal projections to latent structures-discriminant analysis score plots and 200-permutation test of plasma metabolomics analysis (n = 8).
A: Orthogonal projections to latent structures-discriminant analysis (OPLS-DA) score plots between normal group (NG) and model group (MG) groups; B: 200-permutation test between NG and MG groups; C: OPLS-DA score plots between MG and high dose group of Atractylodes japonica (HA) groups; D: 200-permutation test between MG and HA groups. OPLS-DA: Orthogonal projections to latent structures-discriminant analysis; MG: Model group; HA: High dose group of Atractylodes japonica.
Figure 8 Enrichment analysis of metabolic markers (n = 8).
A: Heatmap of potential biomarkers and the degree of the changes are marked in red (up-regulation) and blue (down-regulation); B: Metabolic pathways involved in the therapeutic effects of Atractylodes japonica on gastric ulcer. NG: Normal group; MG: Model group; HA: High dose group of Atractylodes japonica.
- Citation: Zhen BX, Cai Q, Li F. Chemical components and protective effects of Atractylodes japonica Koidz. ex Kitam against acetic acid-induced gastric ulcer in rats. World J Gastroenterol 2023; 29(43): 5848-5864
- URL: https://www.wjgnet.com/1007-9327/full/v29/i43/5848.htm
- DOI: https://dx.doi.org/10.3748/wjg.v29.i43.5848


