Copyright
©The Author(s) 2023.
World J Gastroenterol. Sep 14, 2023; 29(34): 5038-5053
Published online Sep 14, 2023. doi: 10.3748/wjg.v29.i34.5038
Published online Sep 14, 2023. doi: 10.3748/wjg.v29.i34.5038
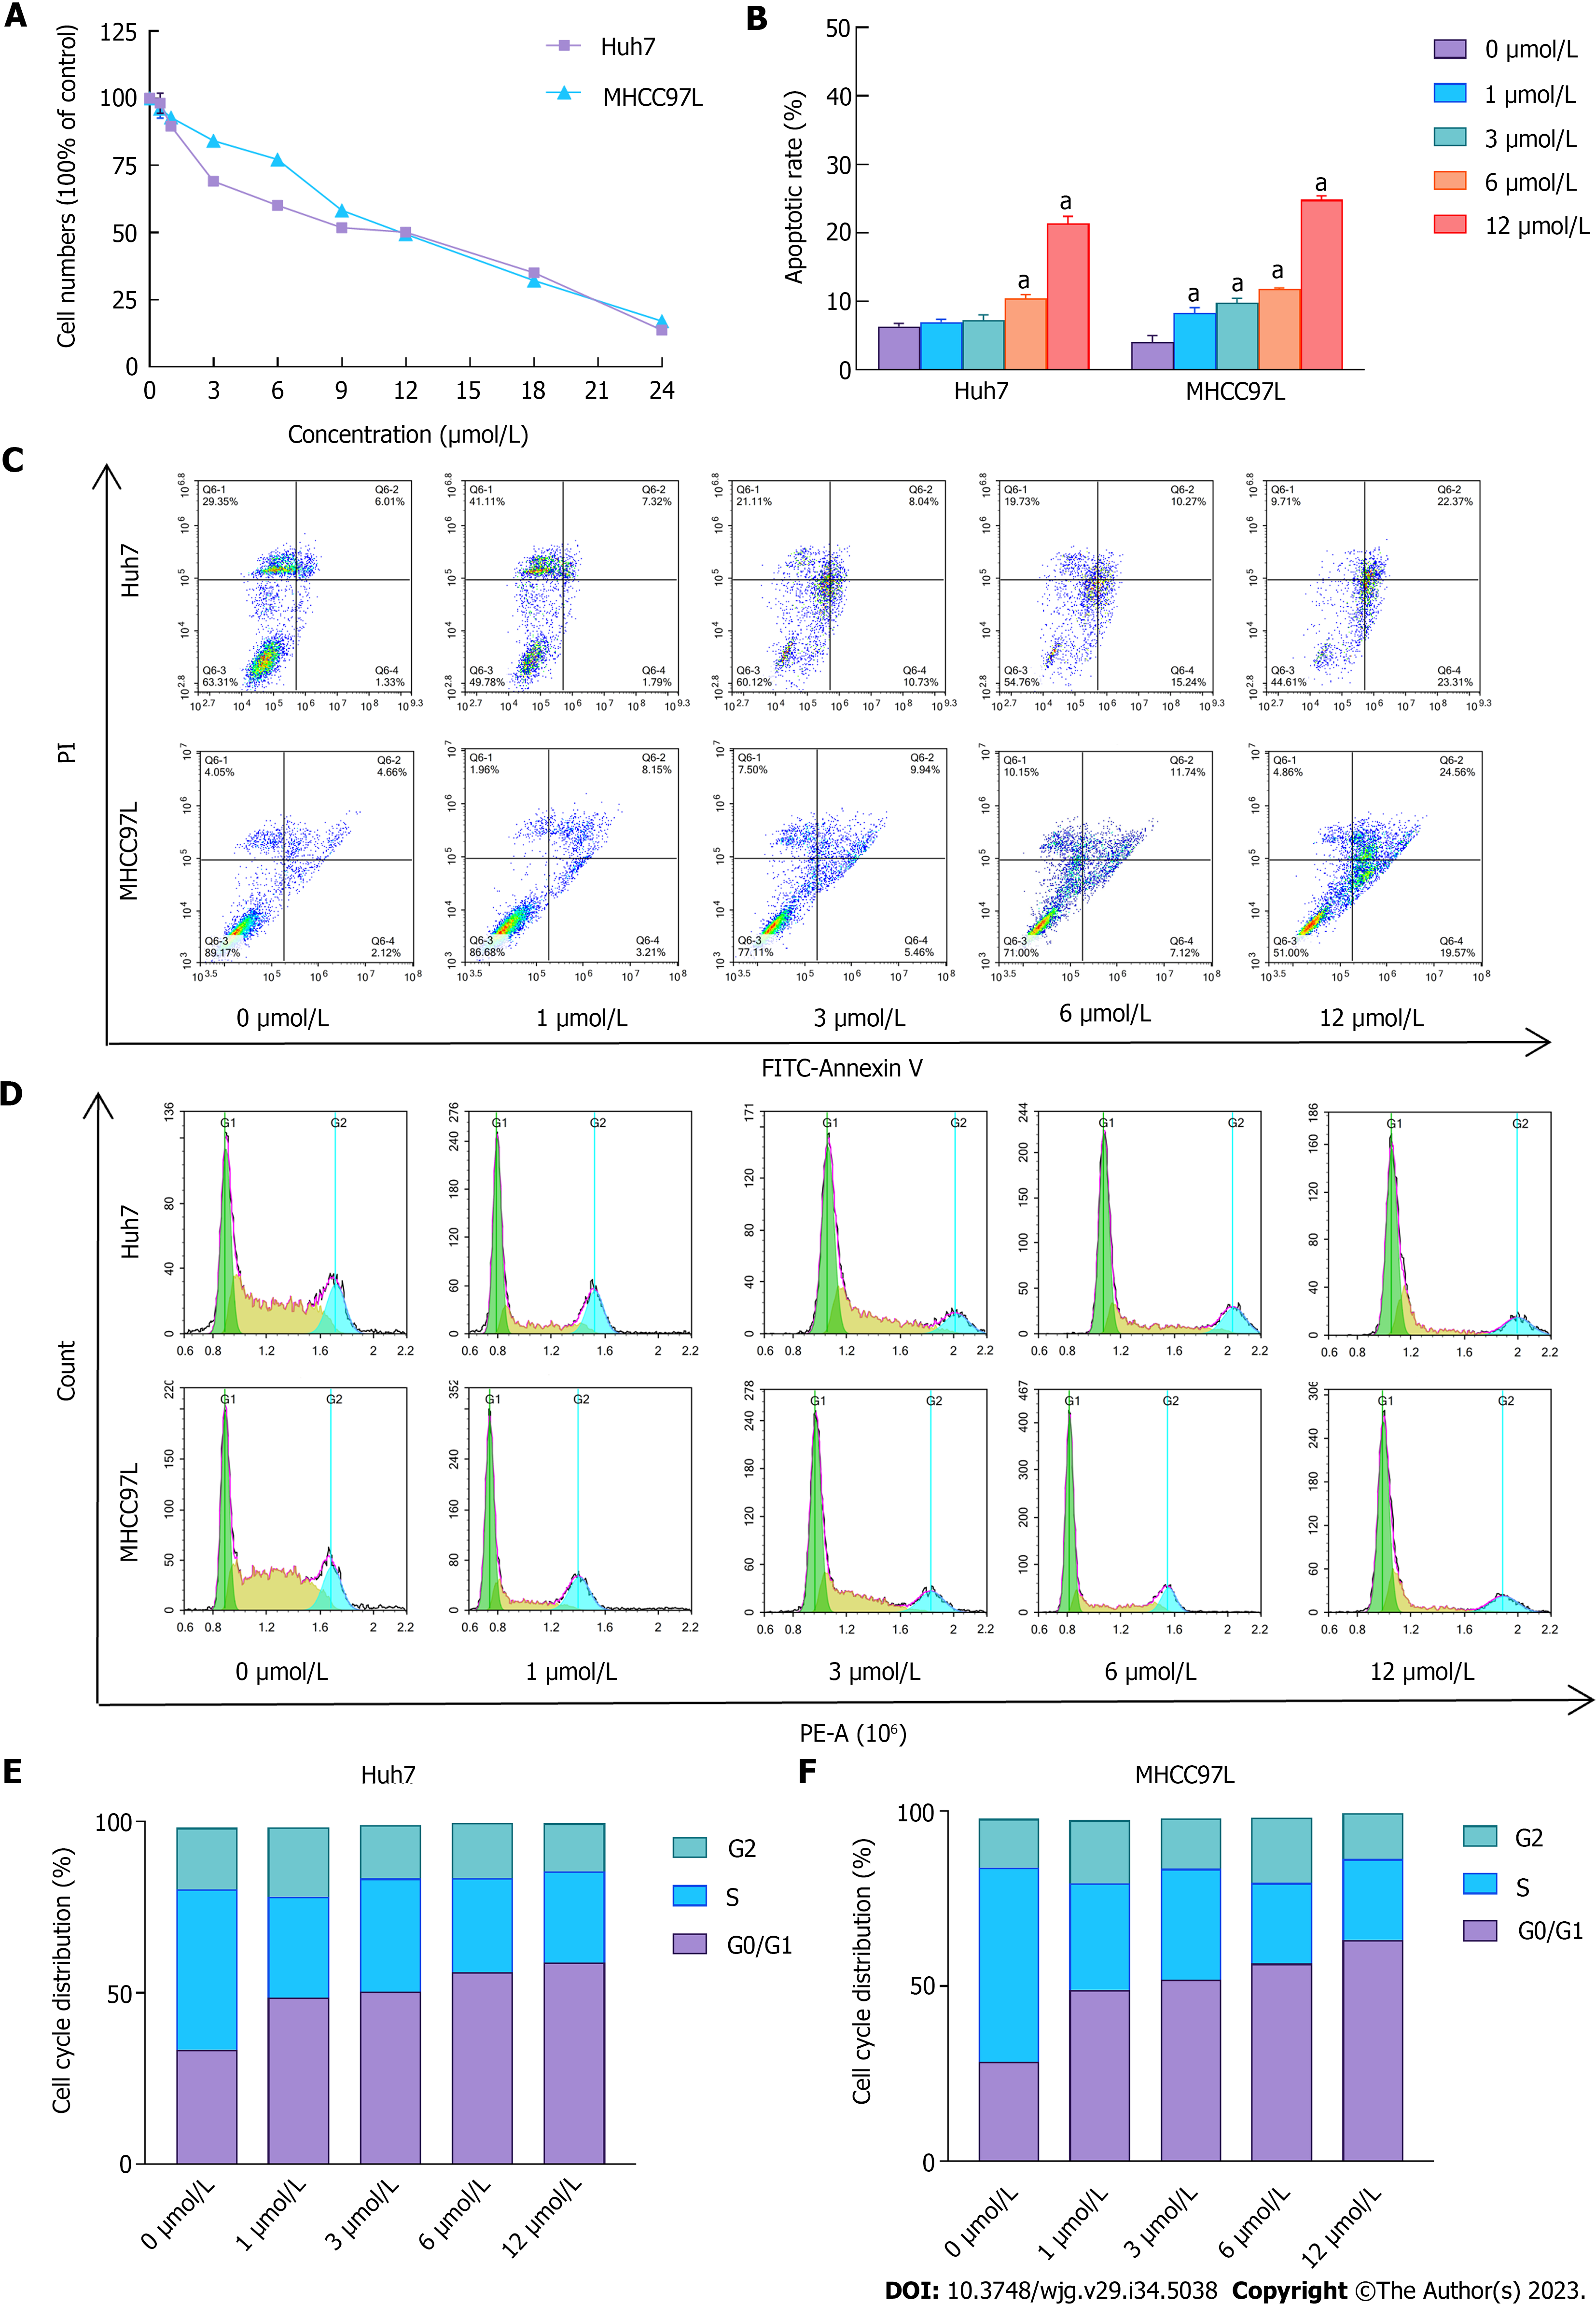
Figure 1 Impact of suberoylanilide hydroxamic acid treatment on cell viability, cell cycle dispersion, and cellular apoptosis in Huh7 and MHCC97L cells.
A: Huh7 and MHCC97L cells were treated with 0, 0.5, 1, 3, 6, 9, 12, 18, and 24 μmol/L suberoylanilide hydroxamic acid (SAHA) for 48 h. The proliferation of Huh7 and MHCC97L cells upon SAHA treatment was monitored using a cell counting kit-8 assay; B-F: Huh7 and MHCC97L cells were exposed to 0, 1, 3, 6, and 12 μmol/L SAHA for 48 h. The proportions of apoptotic cells and the cell cycle dispersion were detected using flow cytometer. Experiments were repeated thrice. Representative results from three independent replicate assays are shown. Data are exhibited as mean ± standard deviation. aP < 0.05 vs 0 μmol/L group (n = 3). PI: Propidium iodide.
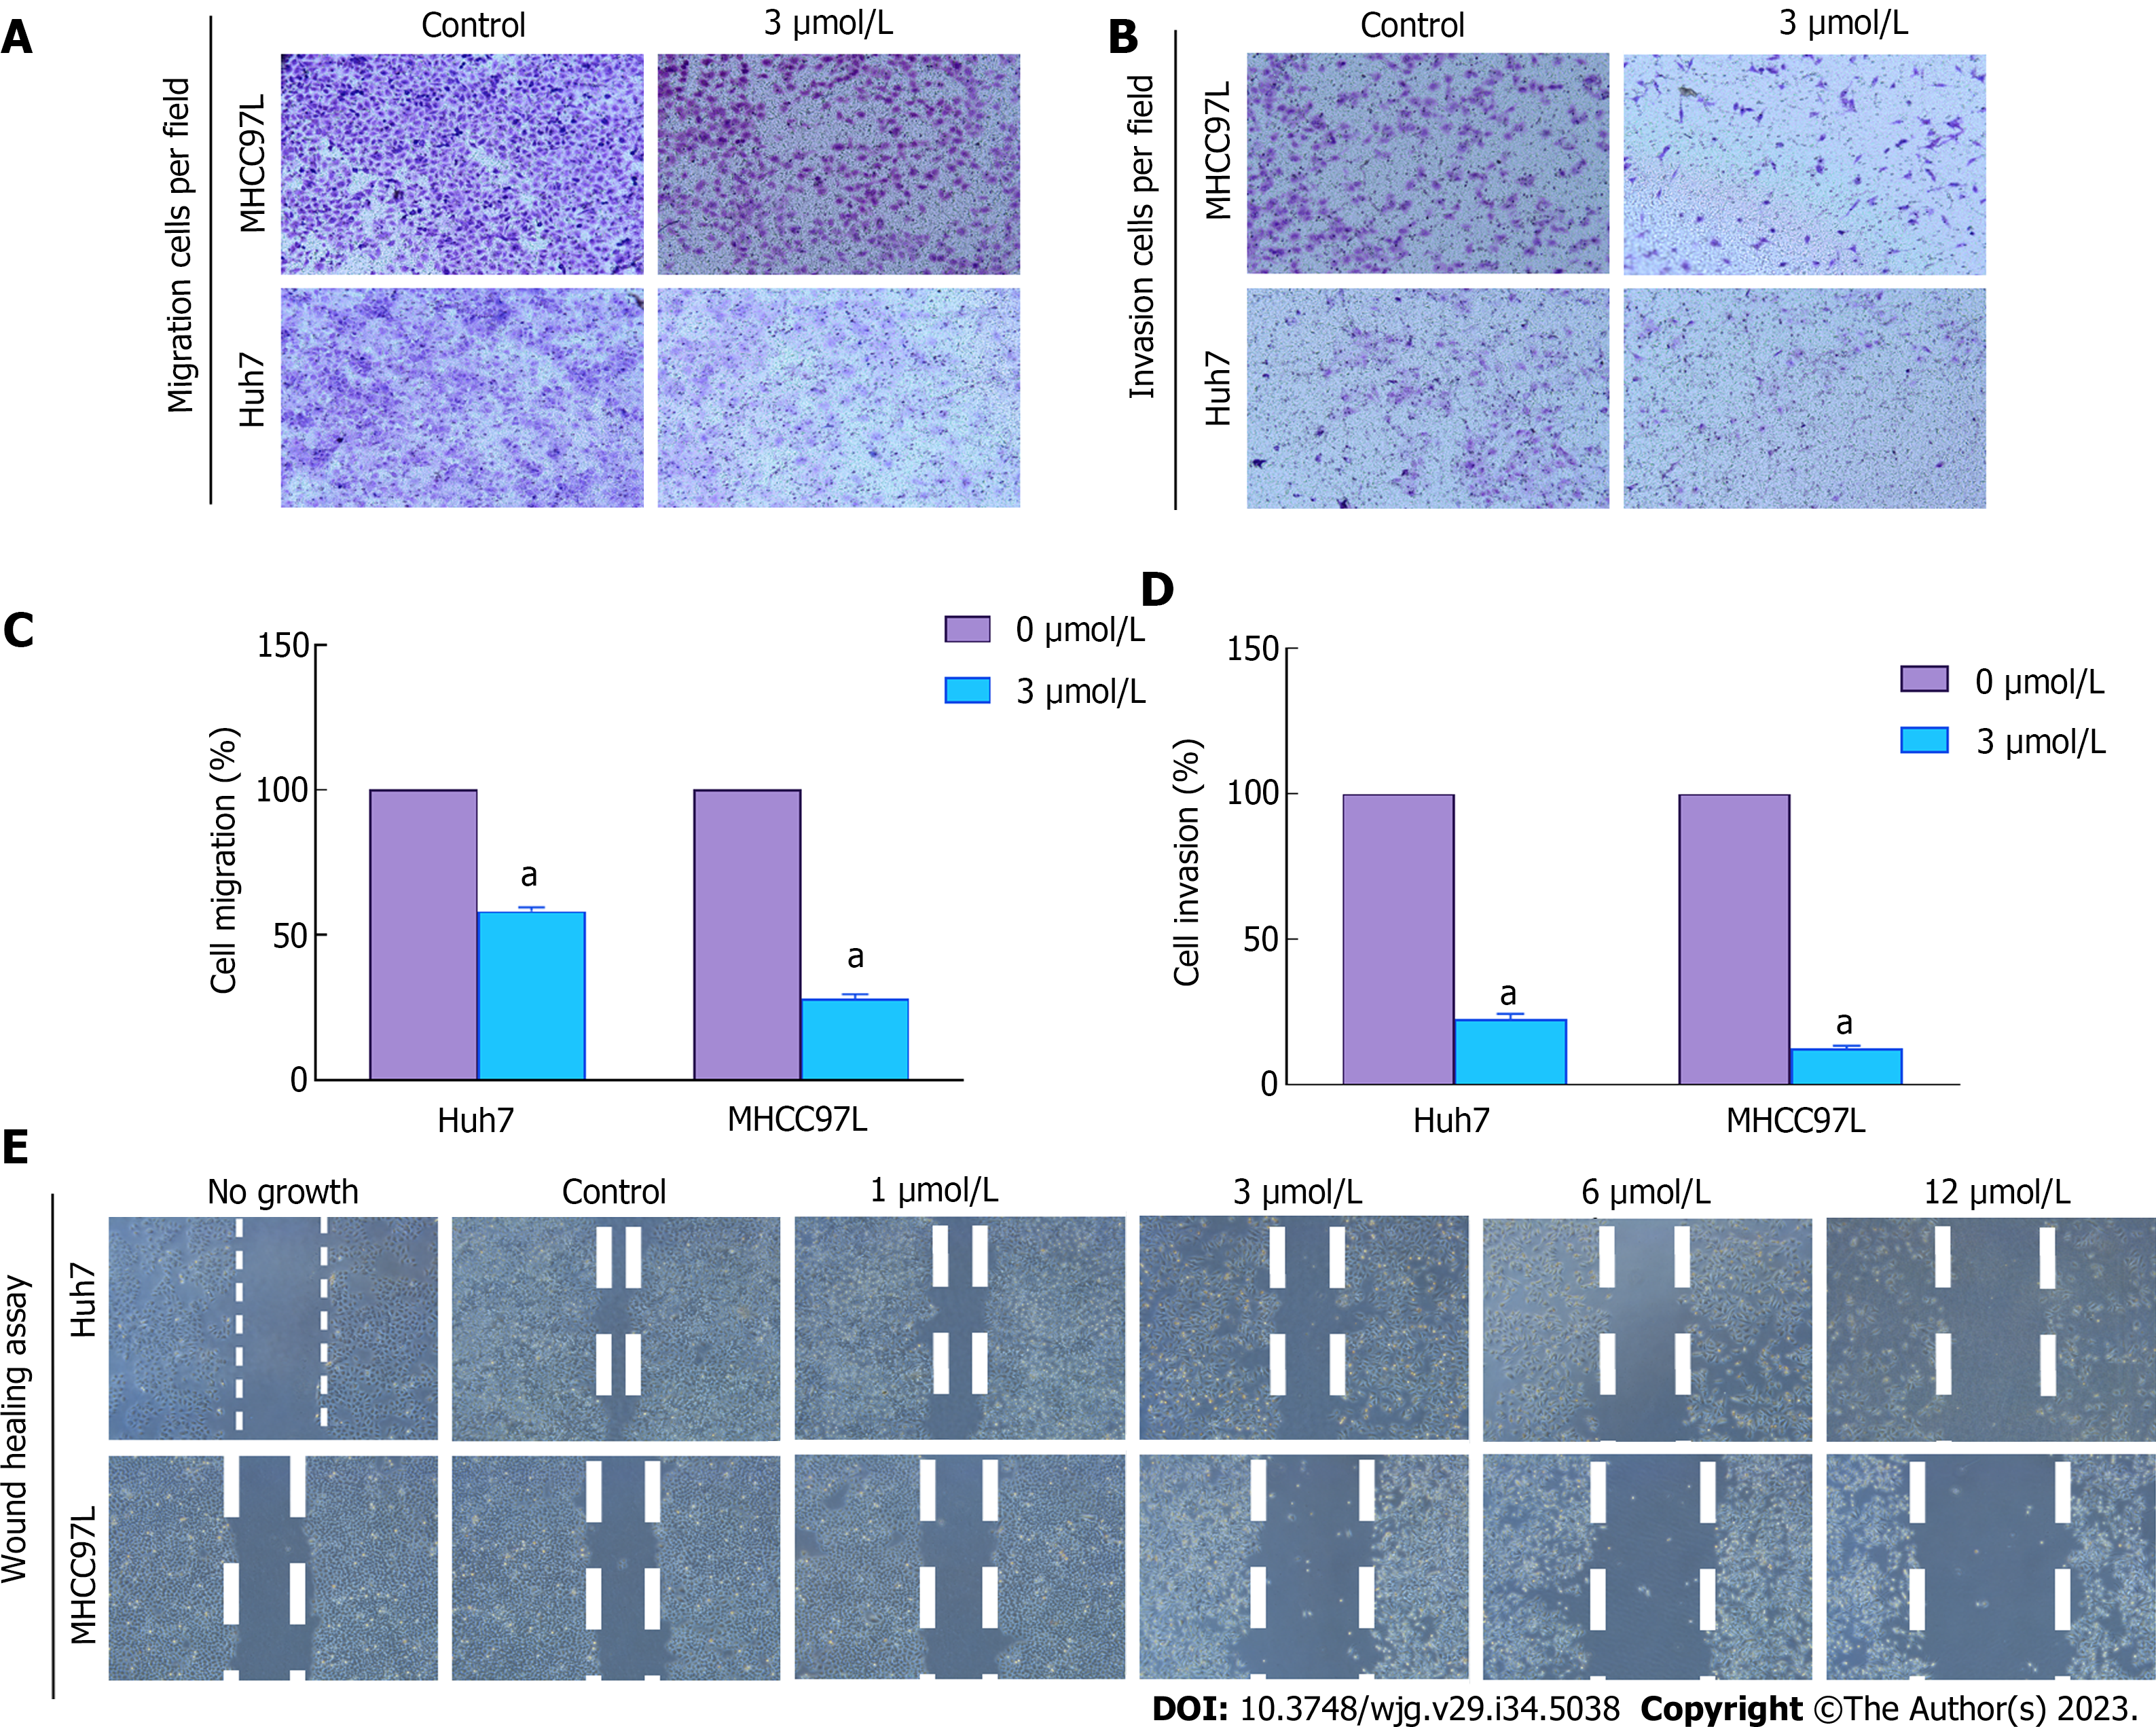
Figure 2 Impact of suberoylanilide hydroxamic acid treatment on the migration and invasion of Huh7 and MHCC97L cells.
A and B: During experimental verification, the mobile ability of hepatocellular carcinoma cells could not be observed in the 6 μmol/L and 12 μmol/L suberoylanilide hydroxamic acid (SAHA) groups and even the cell growth was directly inhibited. Therefore, we selected 3 μmol/L SAHA to treat Huh7 and MHCC97L cells in a transwell assay. Both cell lines were vehicle-treated with 0.1% dimethyl sulfoxide or exposed to 3 μmol/L SAHA for 48 h. The migration and invasion behavior of cells was evaluated by calculating the cells stained using crystal violet. Representative pictures of invaded hepatocellular carcinoma cells from three independent replicate assays are exhibited; C and D: Statistical graphs; E: In the cell scratch experiment, the space in the middle was artificially divided into regions to observe the motility of Huh7 and MHCC97L cells upon treatment with various doses of SAHA (0, 1, 3, 6, and 12 μmol/L) for 48 h. All cells were observed under an inverted microscope with a 40-fold objective lens. Data are exhibited as mean ± standard deviation. aP < 0.05 vs control group (n = 3).
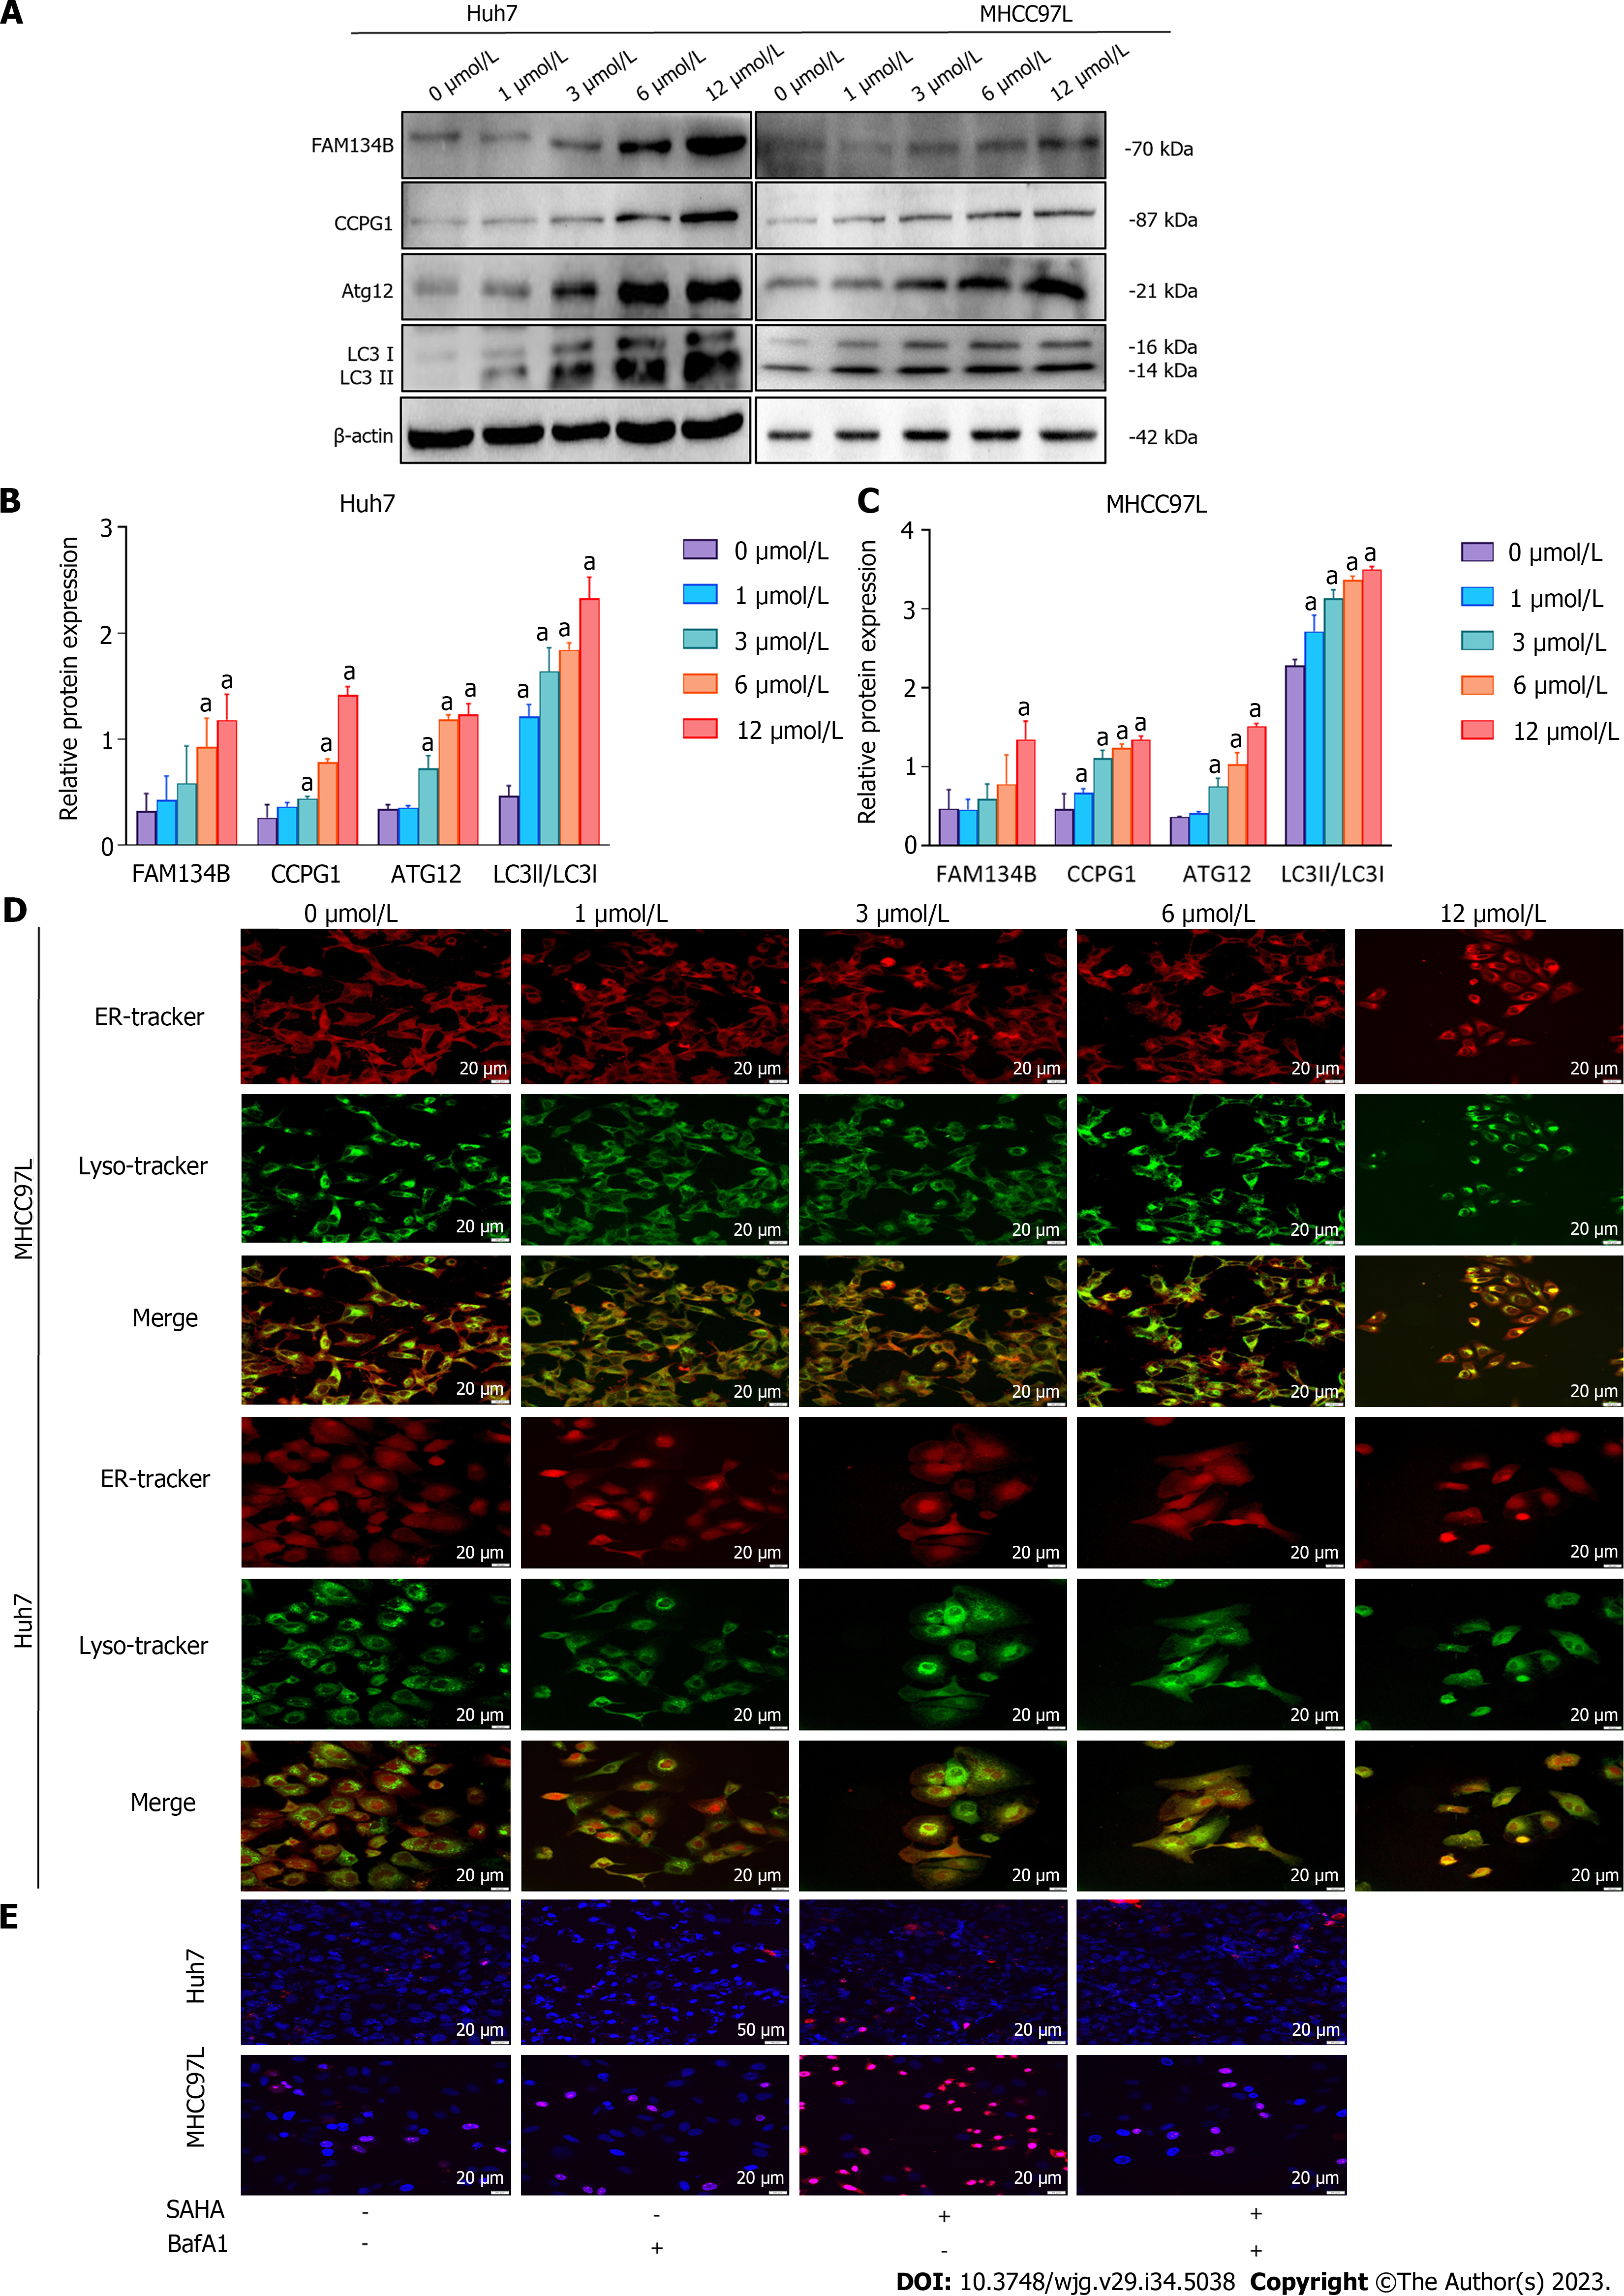
Figure 3 Impact of suberoylanilide hydroxamic acid treatment on the level of endoplasmic reticulum-phagy and autophagy-mediated cell death in Huh7 and MHCC97L cells.
A-C: Huh7 and MHCC97L cells were exposed to 0, 1, 3, 6, and 12 μmol/L suberoylanilide hydroxamic acid for 48 h. Proteins related to the reticulophagy pathway were detected using western blotting. Relative protein expression levels were normalized to β-actin; D: The colocalization coverage of the endoplasmic reticulum and lysosomes were observed using a confocal microscope (× 400). Representative pictures from three independent replicate assays are exhibited; E: Huh7 and MHCC97L cells were pretreated with 0.5 nmol/L BafA1 for 12 h, followed by 12 μmol/L suberoylanilide hydroxamic acid treatment for 48 h. Hoechst 33342/propidium iodide (PI) double staining localization assay was utilized to observe nuclear coagulation. After Hoechst 33342/PI double staining, the death rate of hepatocellular carcinoma cells was quantified based on the ratio of pink cells/blue cells. Experiments were repeated thrice. Representative pictures from three independent replicate assays are shown. Data are exhibited as mean ± standard deviation. aP < 0.05 vs 0 μmol/L group. SAHA: Suberoylanilide hydroxamic acid; ER: Endoplasmic reticulum; FAM134B: Family with sequence similarity 134 member B.
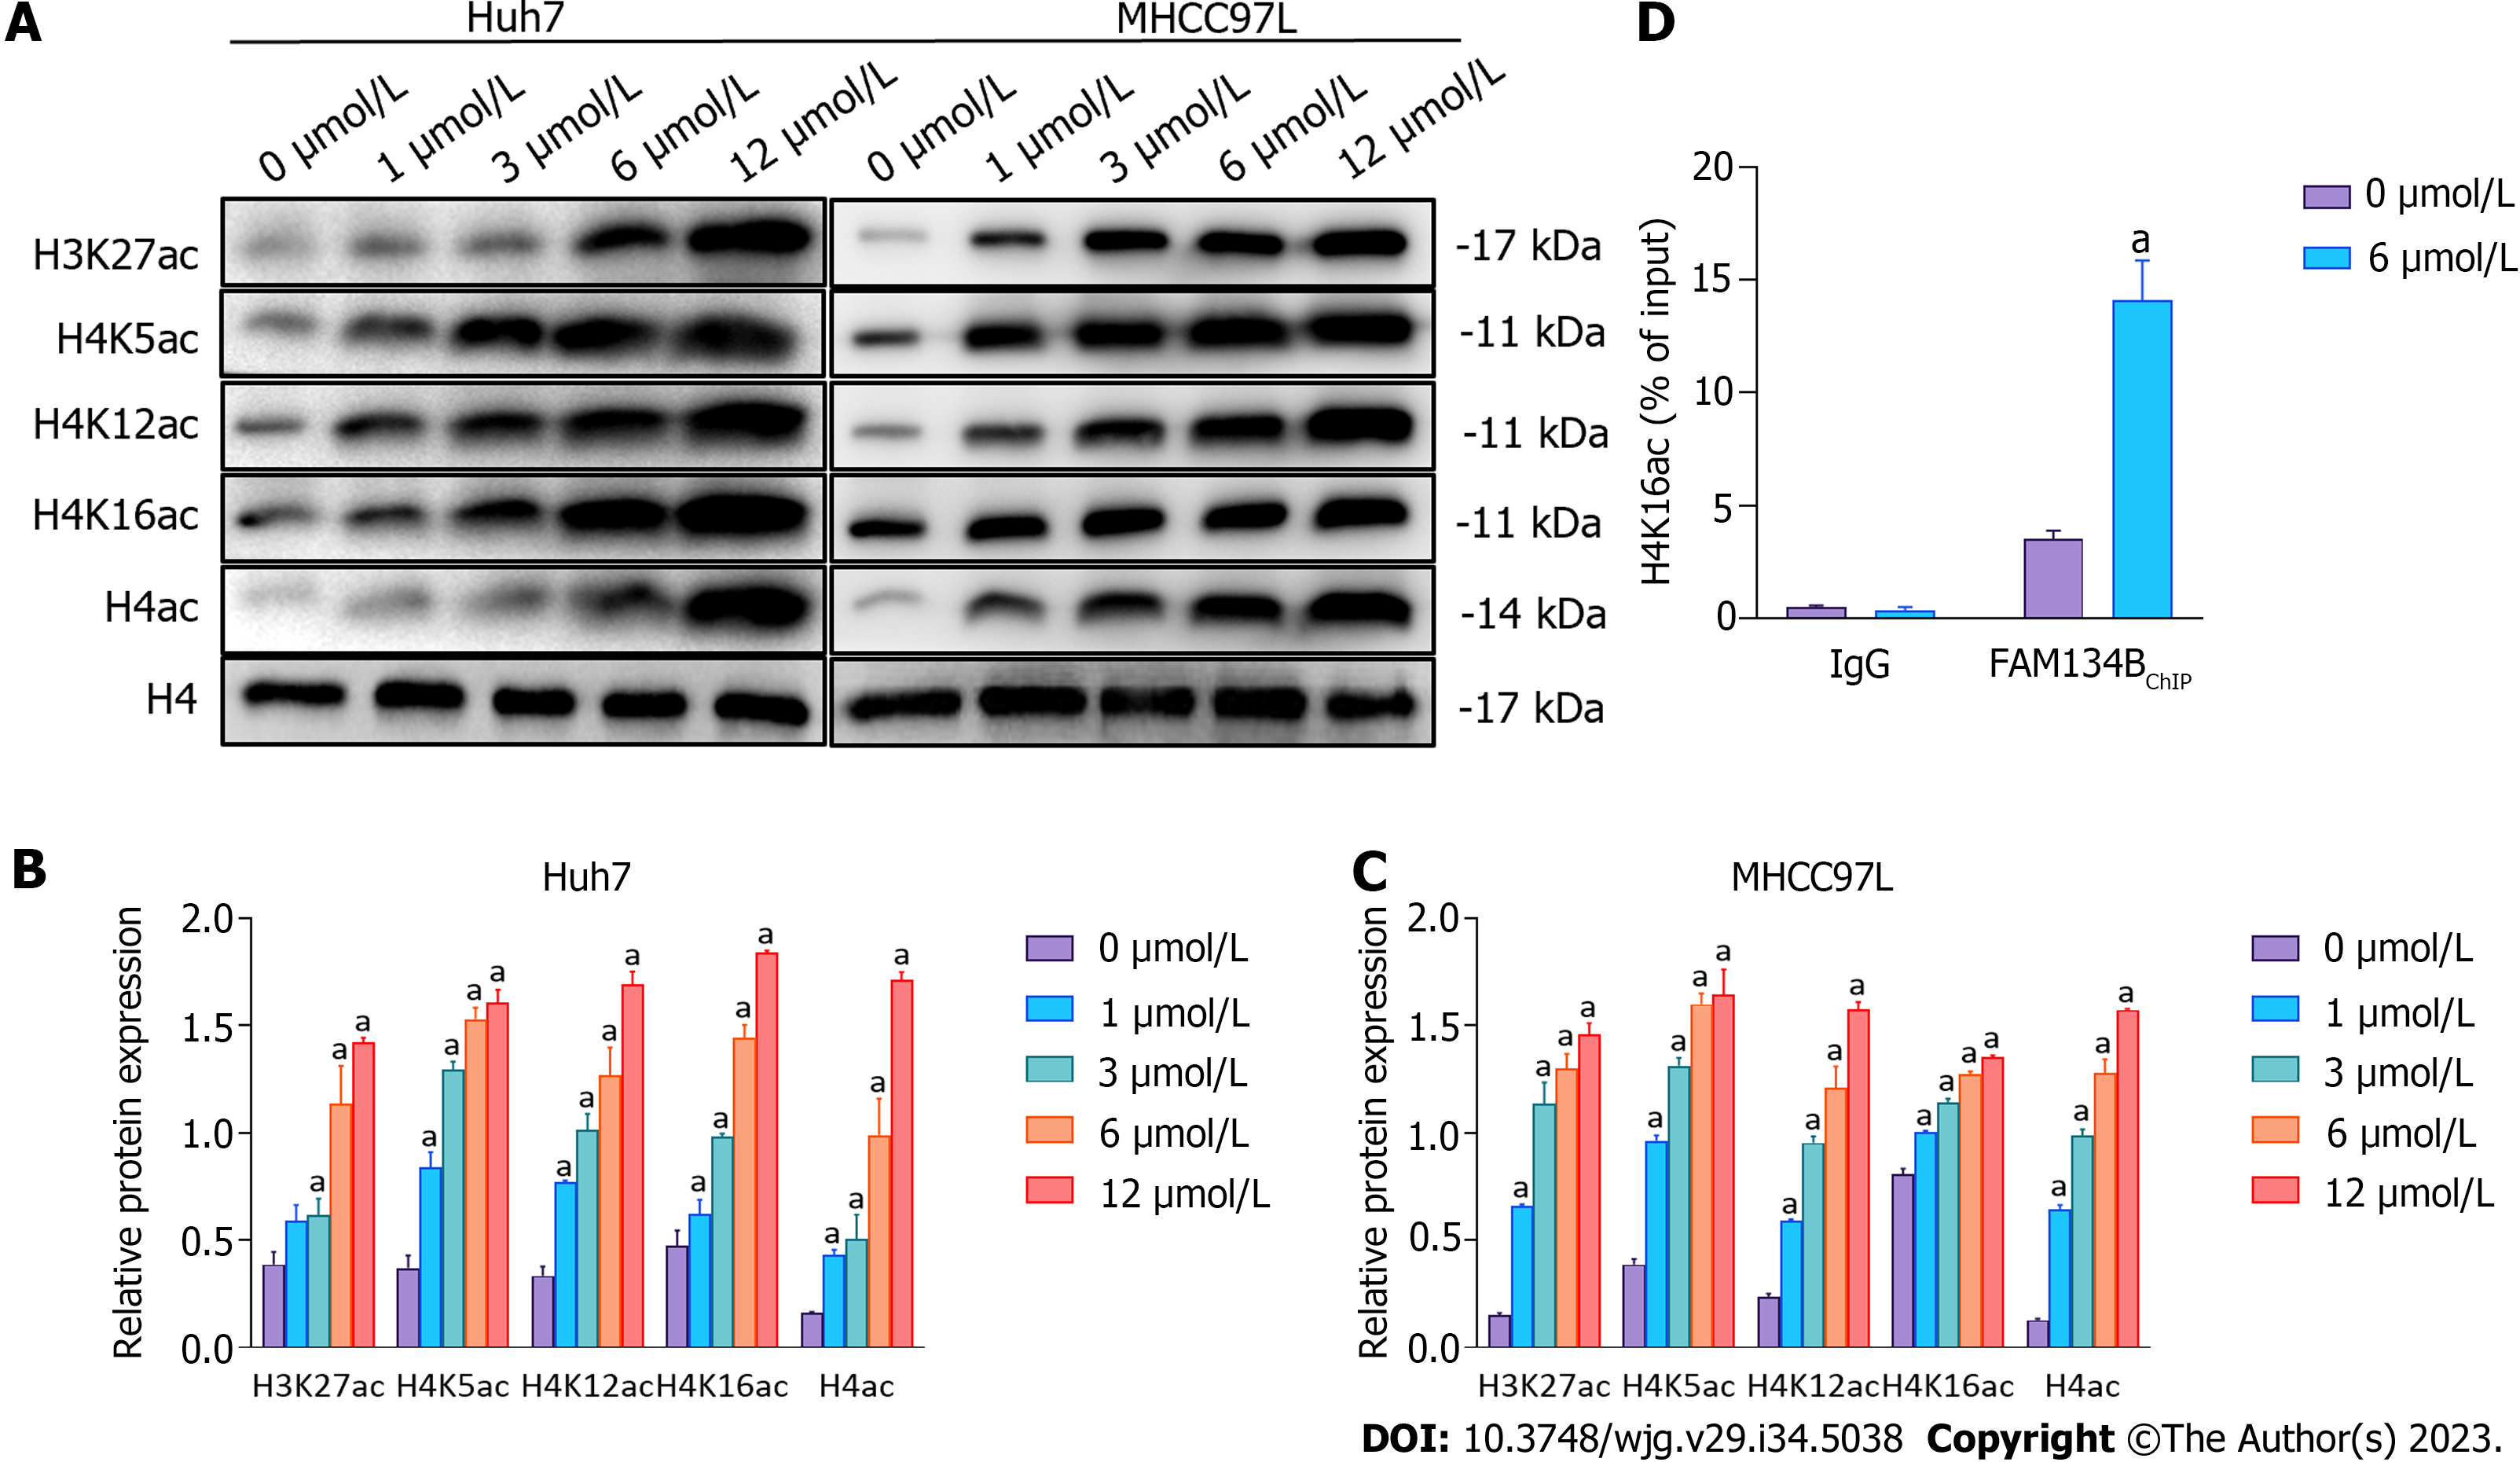
Figure 4 Impact of suberoylanilide hydroxamic acid treatment on the levels of histone H4 lysine 16 acetylation in the promoter region of family with sequence similarity 134 member B in Huh7 and MHCC97L cells.
A-C: Huh7 and MHCC97L cells were exposed to 0, 1, 3, 6, and 12 μmol/L suberoylanilide hydroxamic acid for 48 h. Relative protein levels of histone H3 lysine 27 acetylation (H3K27ac), total H4ac, H4K5ac, H4K12ac, and H4K16ac were normalized to total histone H4. Representative western blot images from three independent replicate assays are exhibited; D: Huh7 cells were exposed to 0 μmol/L or 6 μmol/L suberoylanilide hydroxamic acid for 48 h. Quantification of the acetylated histone H4K16-related promoter region of family with sequence similarity 134 member B in Huh7 cells was measured using chromatin immunoprecipitation assay and quantitative polymerase chain reaction. Data are exhibited as mean ± standard deviation. aP < 0.05 vs 0 μmol/L group (n = 3). FAM134B: Family with sequence similarity 134 member B; ChIP: Chromatin immunoprecipitation.
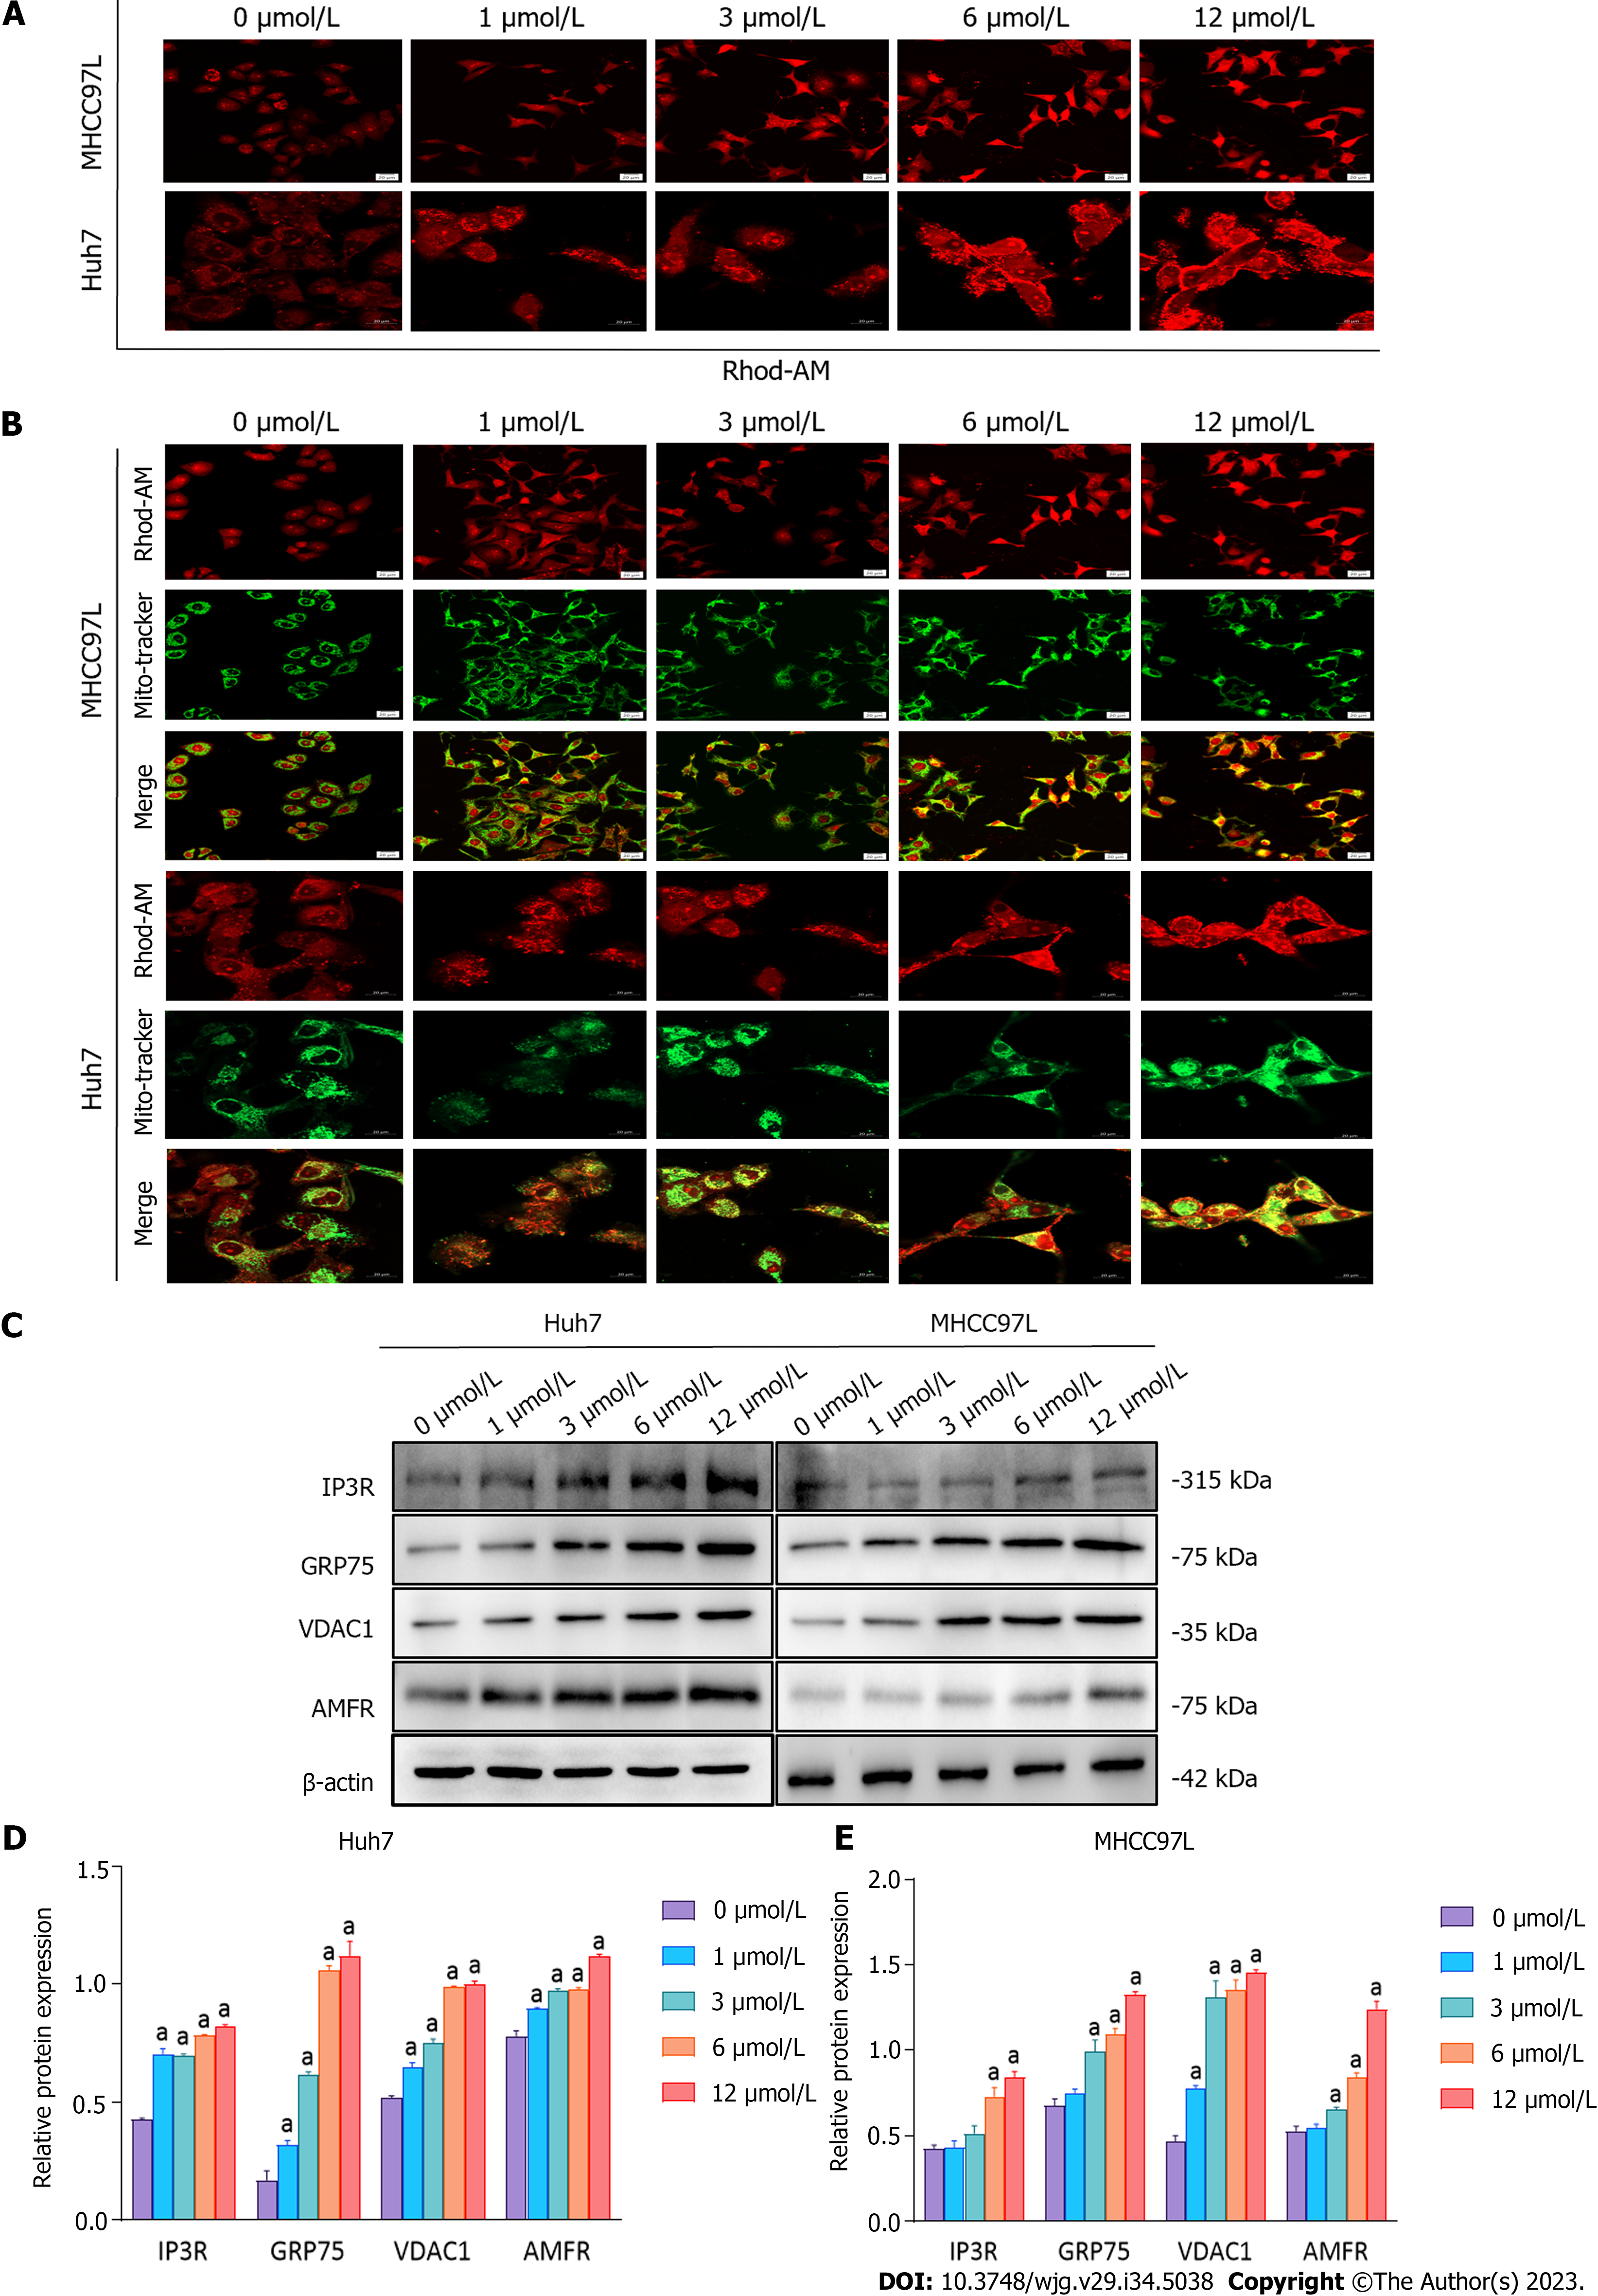
Figure 5 Impact of suberoylanilide hydroxamic acid treatment on Ca2+ homeostasis and the expression of autocrine motility factor receptor and proteins related to mitochondria-endoplasmic reticulum contact sites in Huh7 and MHCC97L cells.
A: Huh7 and MHCC97L cells were exposed to 0, 1, 3, 6, and 12 μmol/L suberoylanilide hydroxamic acid (SAHA) for 48 h and stained with Rhod-2 AM. The cells were observed under a confocal microscope (× 400 magnification); B: Huh7 and MHCC97L cells were exposed to 0, 1, 3, 6, and 12 μmol/L SAHA for 48 h and simultaneously stained with Mito-Tracker Green and Rhod-2 AM Red. The cells were observed under a confocal microscope (× 400 magnification). The scale is 100 μm; C-E: Representative western blot images showed the expression of inositol 1, 4, 5-trisphosphate receptor type 1, glucose-regulated protein 75, voltage-dependent anion channel 1, and autocrine motility factor receptor in Huh7 and MHCC97L cells treated with SAHA for 48 h. Relative protein expression levels were normalized to β-actin. Data are exhibited as mean ± standard deviation. aP < 0.05 vs 0 μmol/L group (n = 3). AMFR: Autocrine motility factor receptor; IP3R1: Inositol 1, 4, 5-trisphosphate receptor type 1; GRP75: Glucose-regulated protein 75; VDAC1: Voltage-dependent anion channel 1.
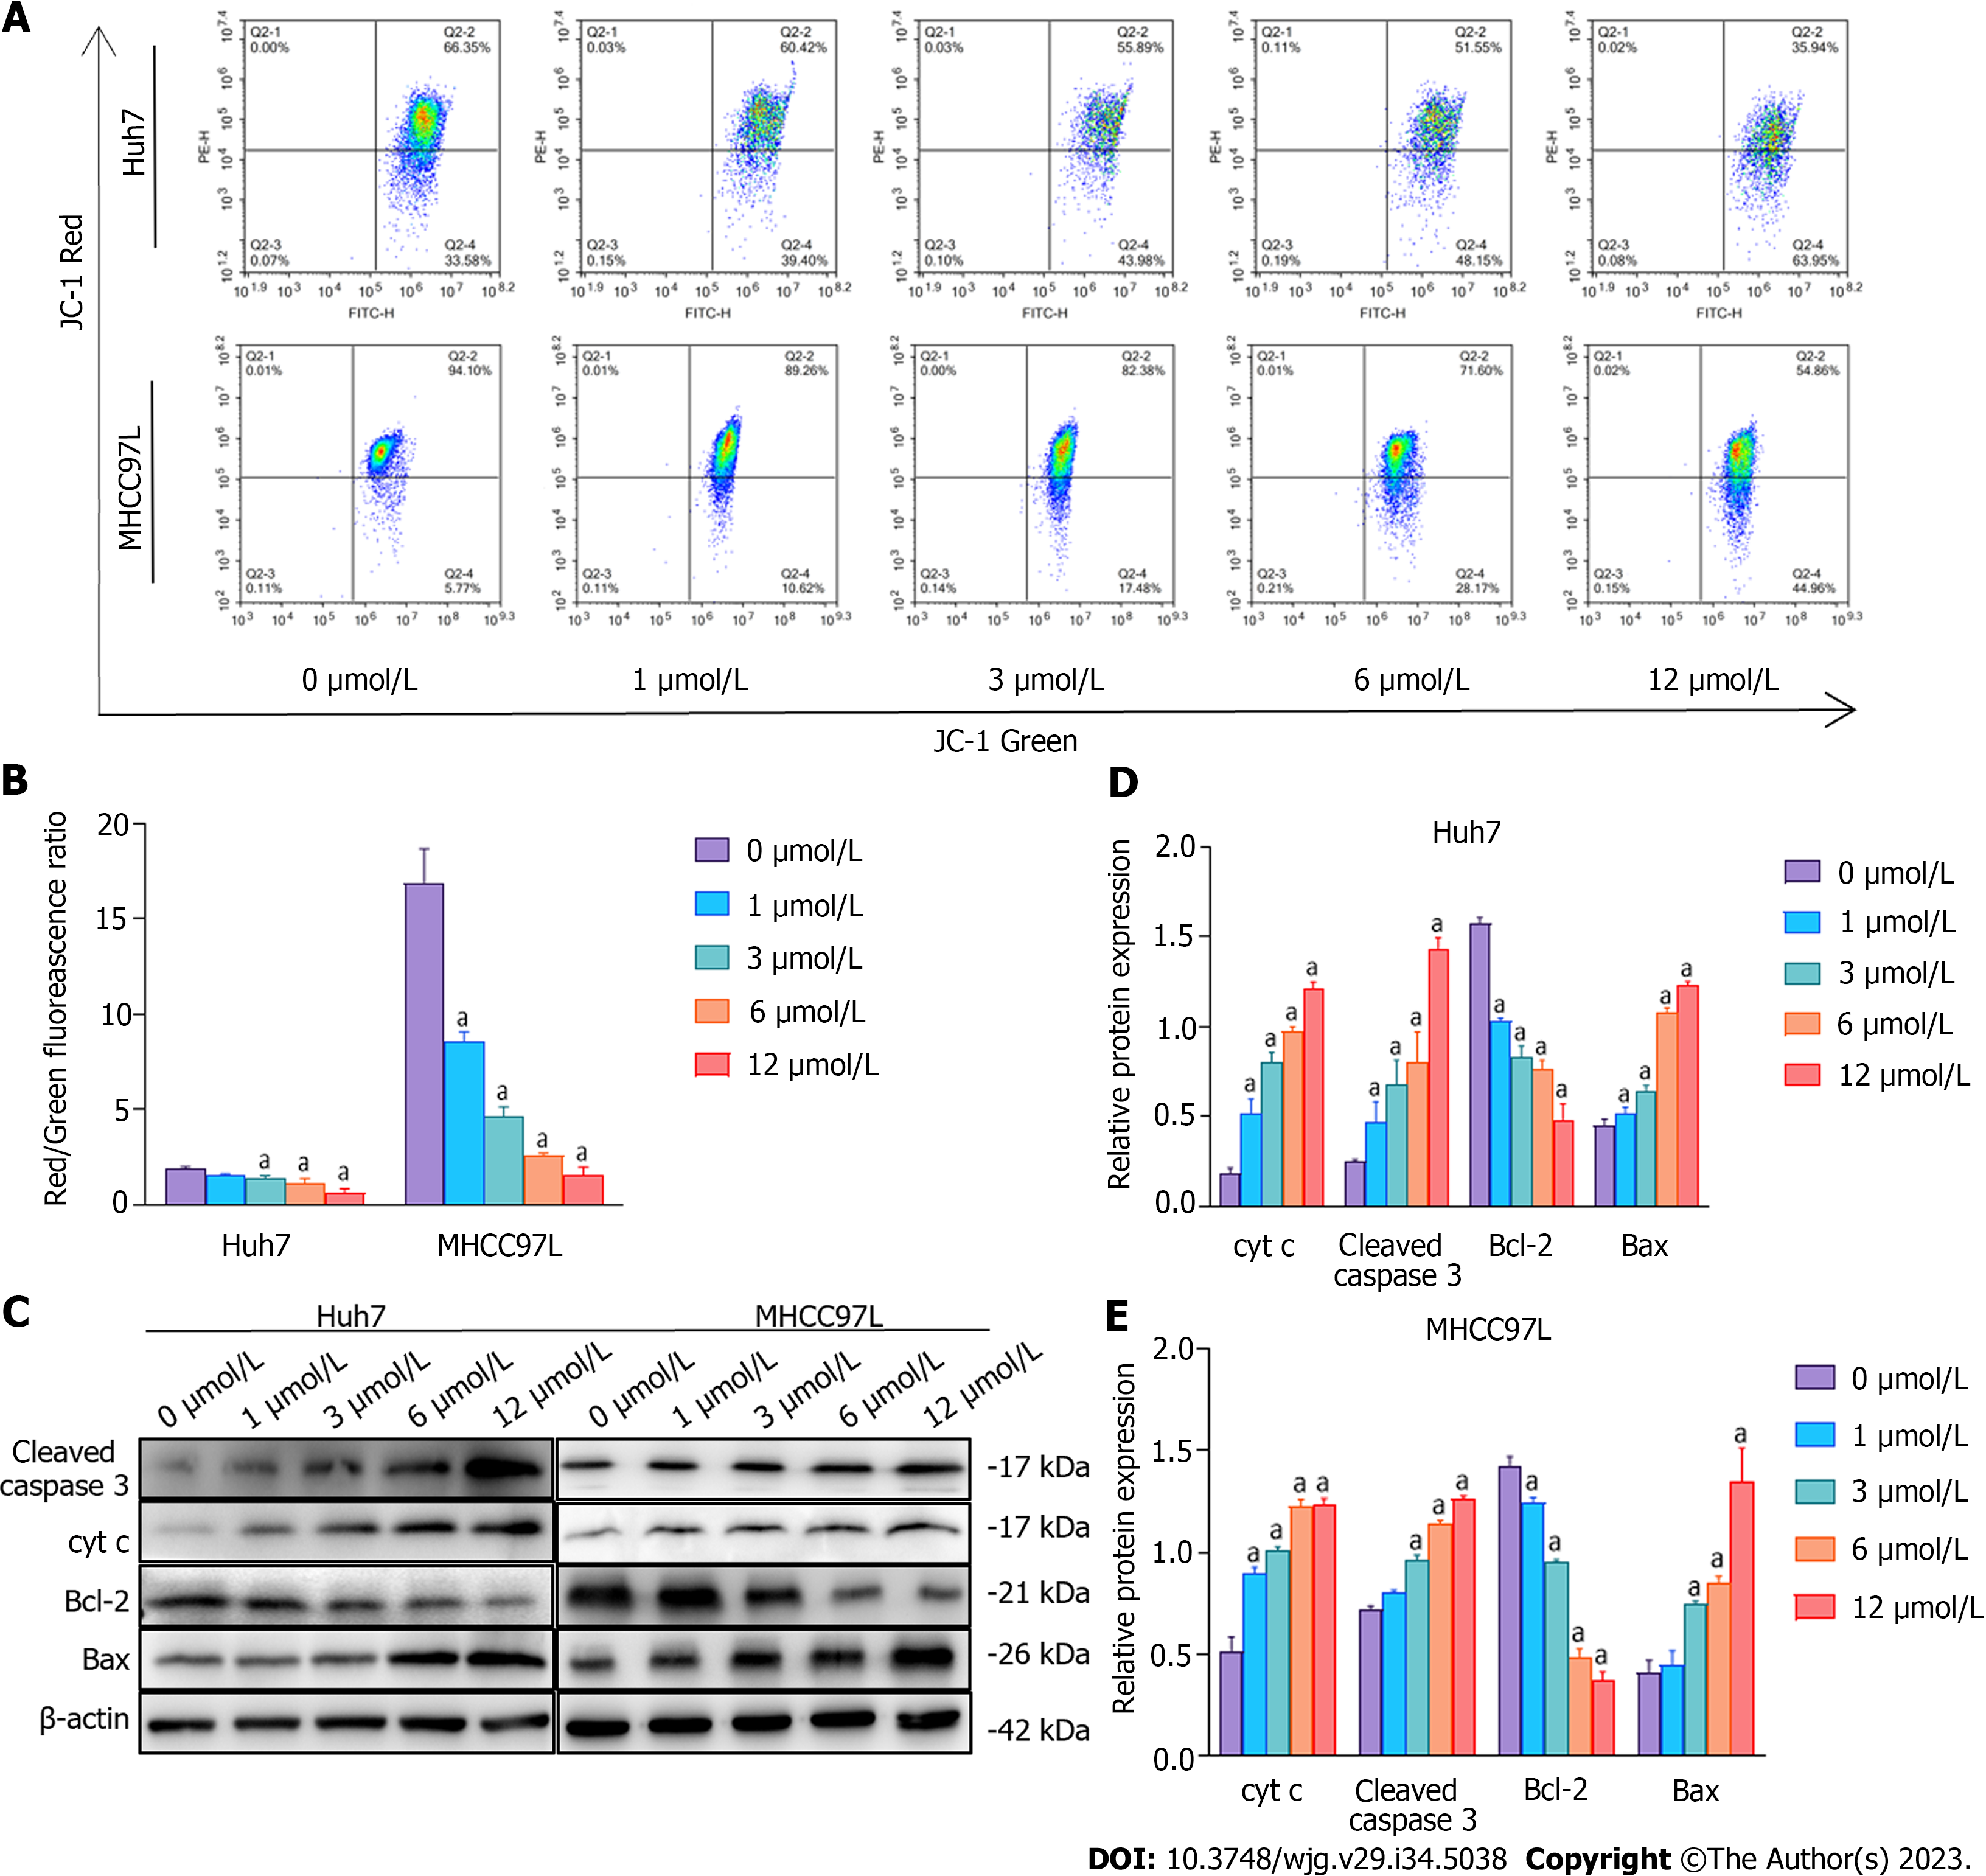
Figure 6 The impact of suberoylanilide hydroxamic acid treatment on mitochondrial membrane potential and the expression of proteins related to the mitochondrial apoptotic pathway in Huh7 and MHCC97L cells.
A and B: After being treated with 0, 1, 3, 6, and 12 μmol/L suberoylanilide hydroxamic acid for 48 h, the mitochondrial membrane potential in Huh7 and MHCC97L cells was analyzed using flow cytometry with bivariable JC-1 dye (mitochondrial membrane potential probe). Representative pictures from three independent replicate assays are exhibited; C-E: Representative western blot images showed the related protein expression in Huh7 and MHCC97L cells treated with 0, 1, 3, 6, and 12 μmol/L suberoylanilide hydroxamic acid for 48 h. Relative protein expression levels were normalized to β-actin. Data are exhibited as mean ± standard deviation. aP < 0.05 vs 0 μmol/L group (n = 3).
- Citation: Li JY, Tian T, Han B, Yang T, Guo YX, Wu JY, Chen YS, Yang Q, Xie RJ. Suberoylanilide hydroxamic acid upregulates reticulophagy receptor expression and promotes cell death in hepatocellular carcinoma cells. World J Gastroenterol 2023; 29(34): 5038-5053
- URL: https://www.wjgnet.com/1007-9327/full/v29/i34/5038.htm
- DOI: https://dx.doi.org/10.3748/wjg.v29.i34.5038


