Copyright
©The Author(s) 2019.
World J Gastroenterol. Aug 14, 2019; 25(30): 4074-4091
Published online Aug 14, 2019. doi: 10.3748/wjg.v25.i30.4074
Published online Aug 14, 2019. doi: 10.3748/wjg.v25.i30.4074
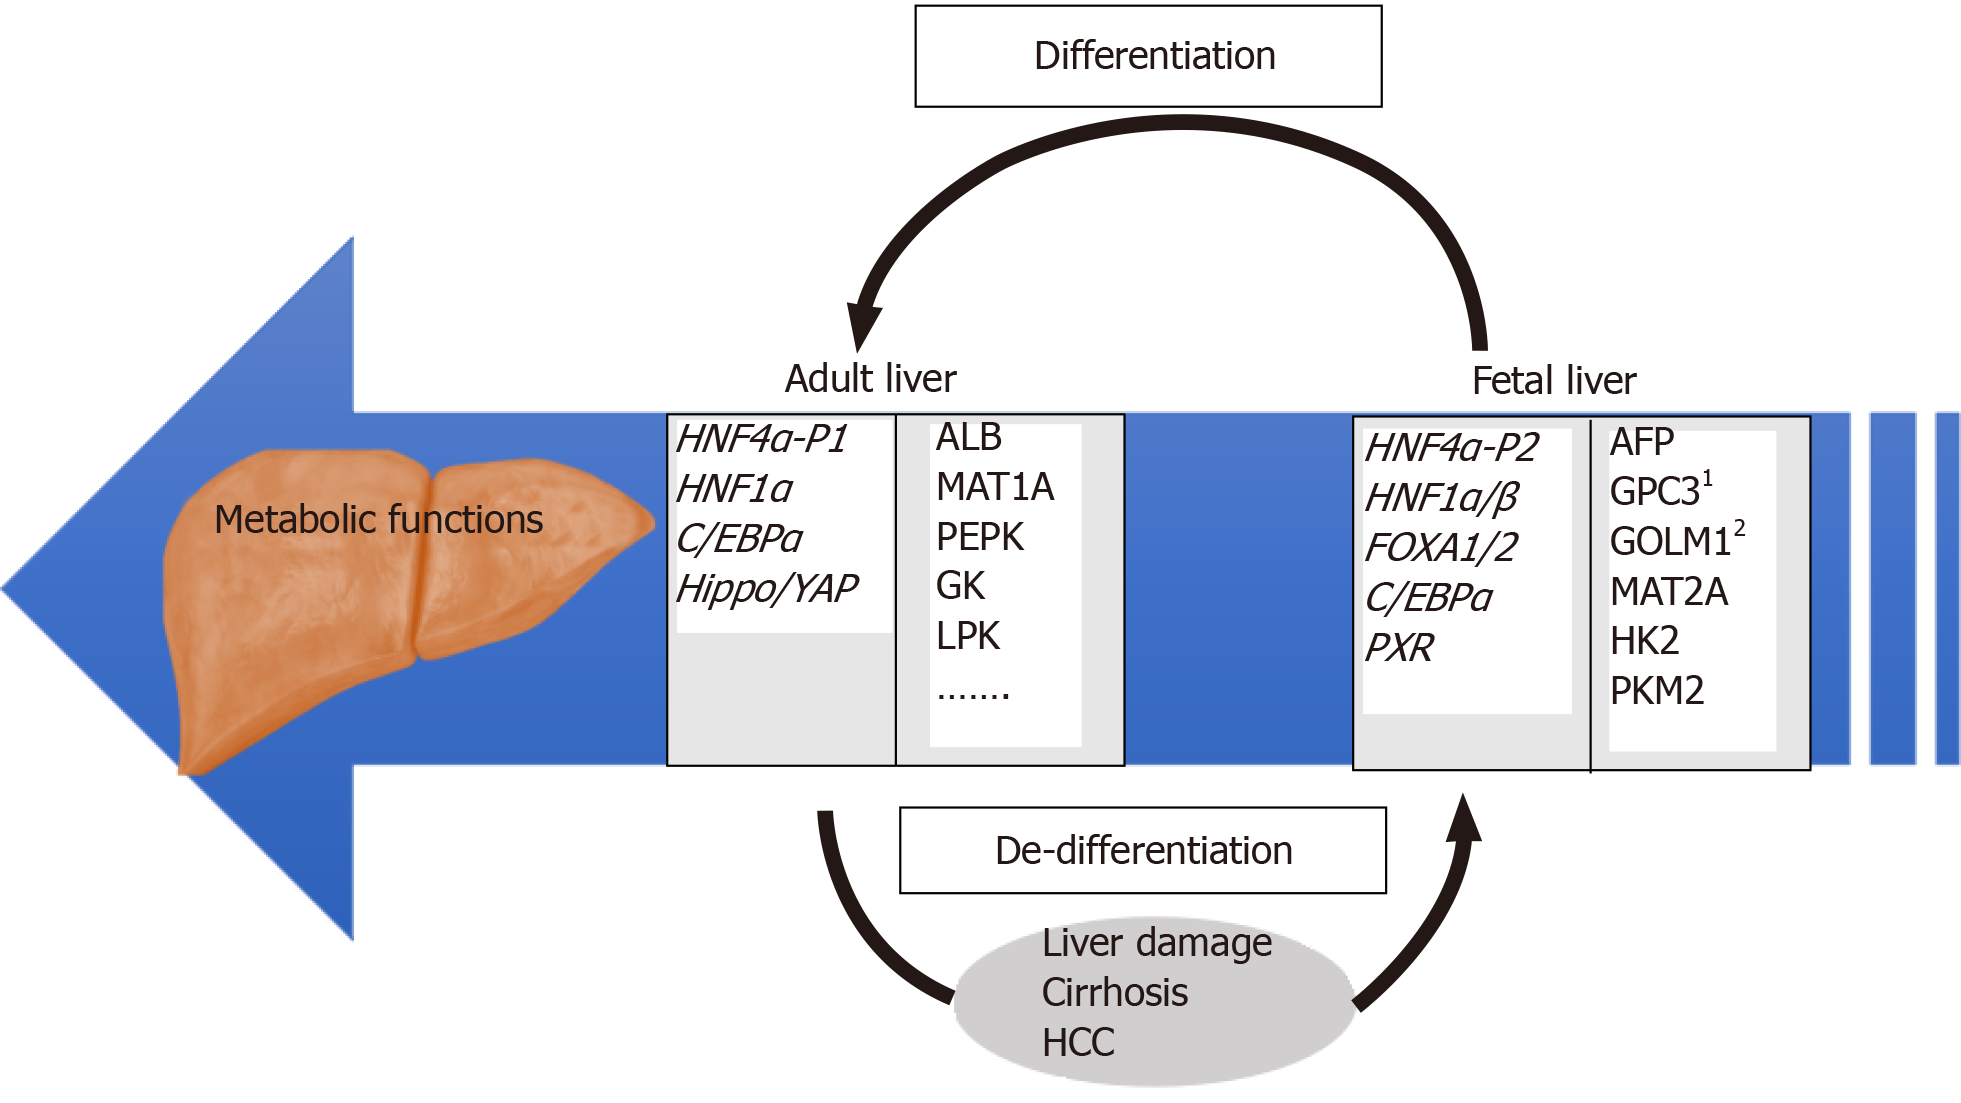
Figure 1 Overview of regulatory and target genes involved in differentiated and de-differentiated stages of liver development.
Examples of relevant HNF4α target genes identified by our group[27] are individually numbered.
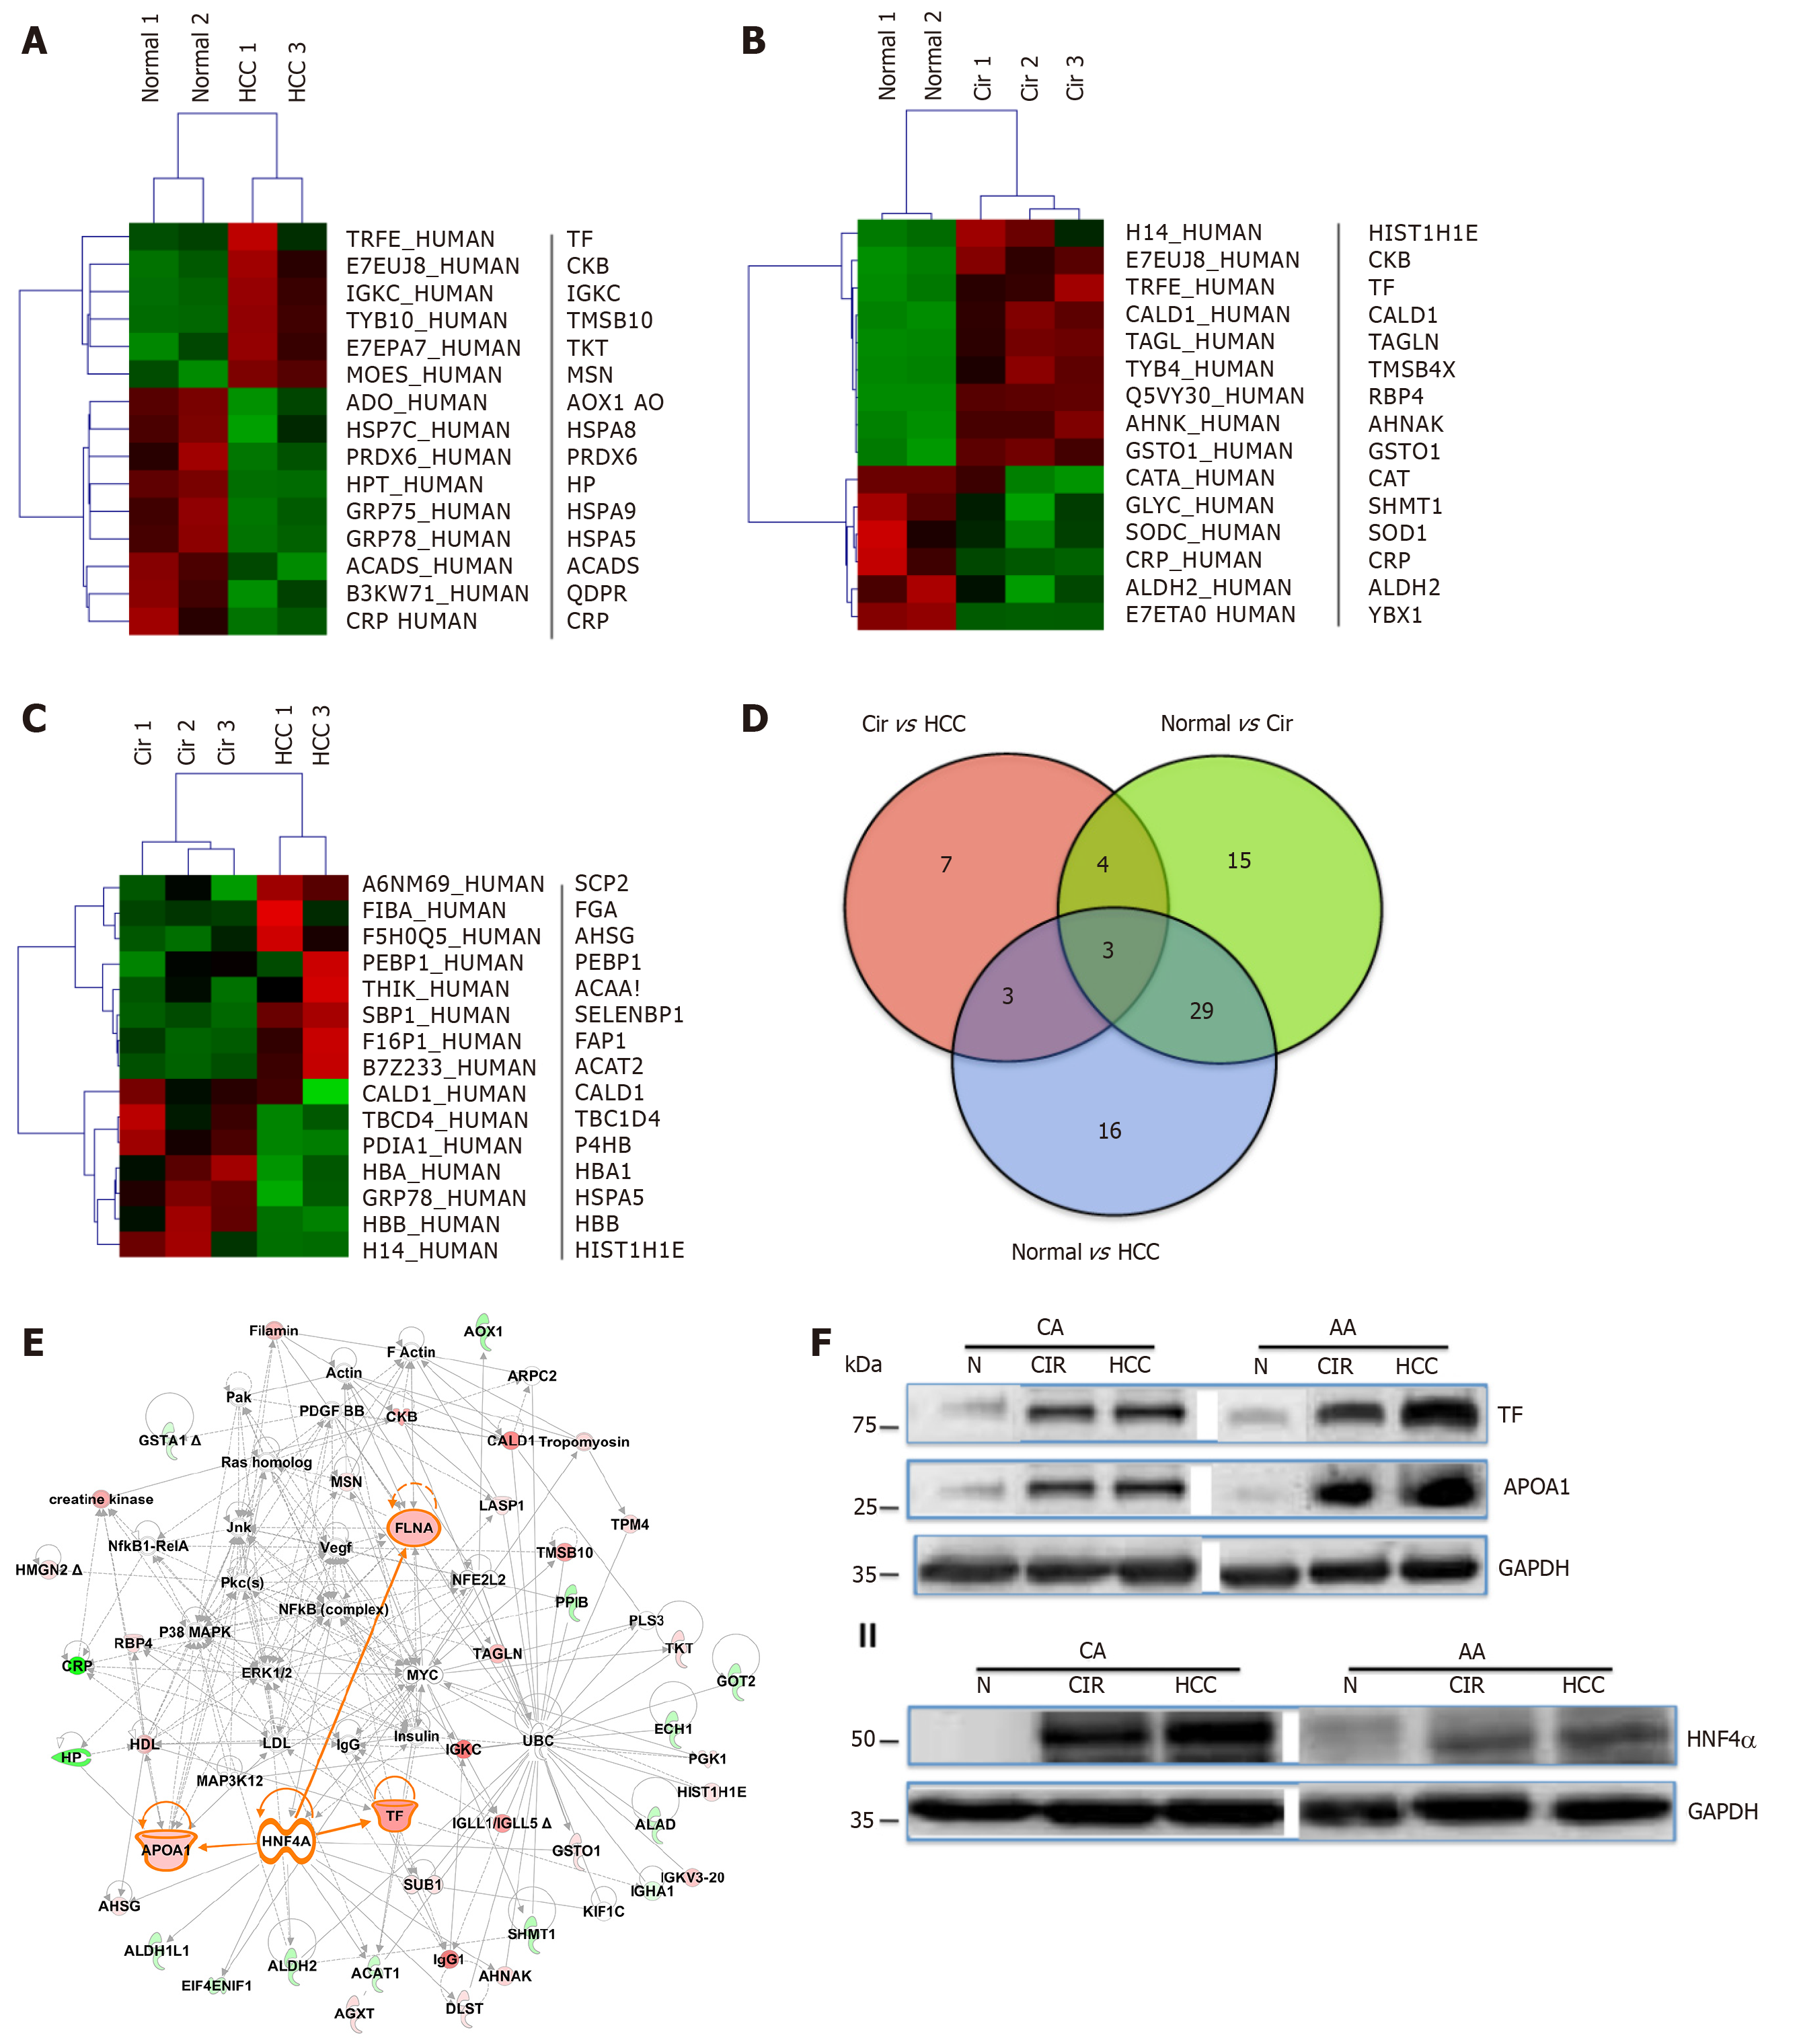
Figure 2 Differentially expressed proteins in normal and liver disease states.
Heat maps of differentially expressed proteins (DEPs) (truncated) that were selected following supervised analysis (A) Normal vs. Cirrhosis, (B) Normal vs. Hepatocellular carcinoma, (C) Cirrhosis vs. Hepatocellular carcinoma, and (D) Venn Diagram comparing the significantly DEPs identified. (E) Interactive Network Analysis of DEPs in cirrhosis and hepatocellular carcinoma as compared to normal shows HNF4α as a focus hub to many DEPs. (F) A representative of immunoblot analysis of TF and APOA1 (upper panel), HNF4α (lower panel) in tissue samples of AA & CA. GAPDH was used as a loading control, as published in[23].
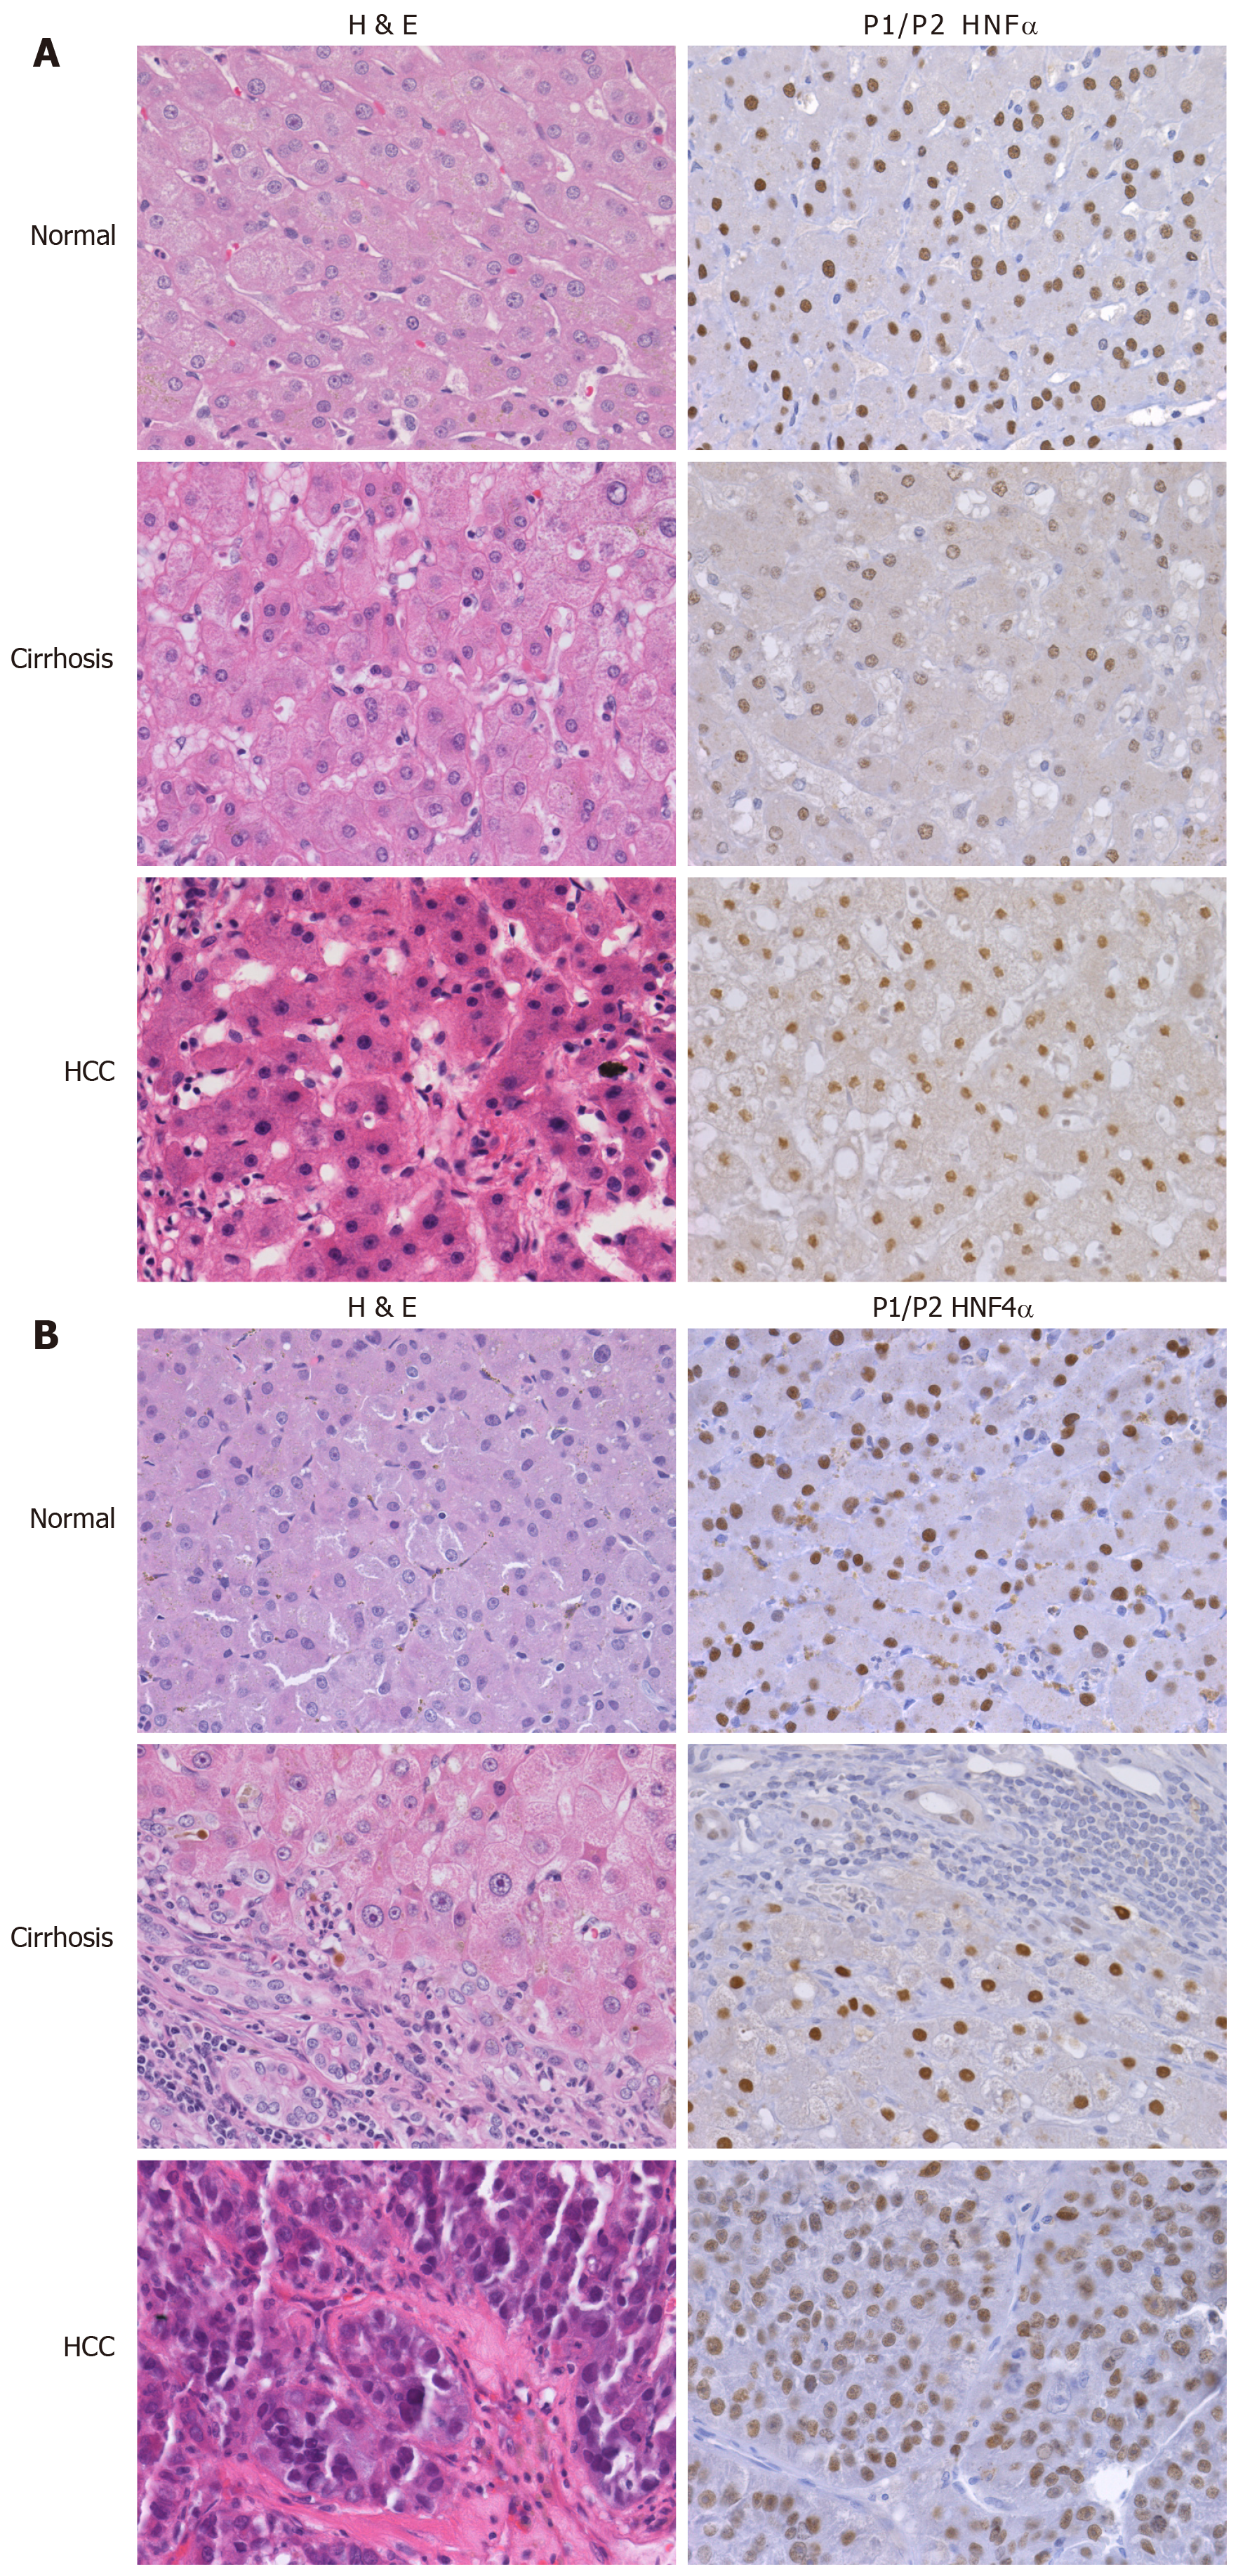
Figure 3 Differential expression of hepatocyte nuclear factor 4alpha in cirrhotic and hepatocellular carcinoma livers.
Representative H&E and P1/P2 HNF4α stained samples of HCV cirrhotic and hepatocellular carcinoma of Caucasian (A) and African American (B) tissue samples, as published in[27].
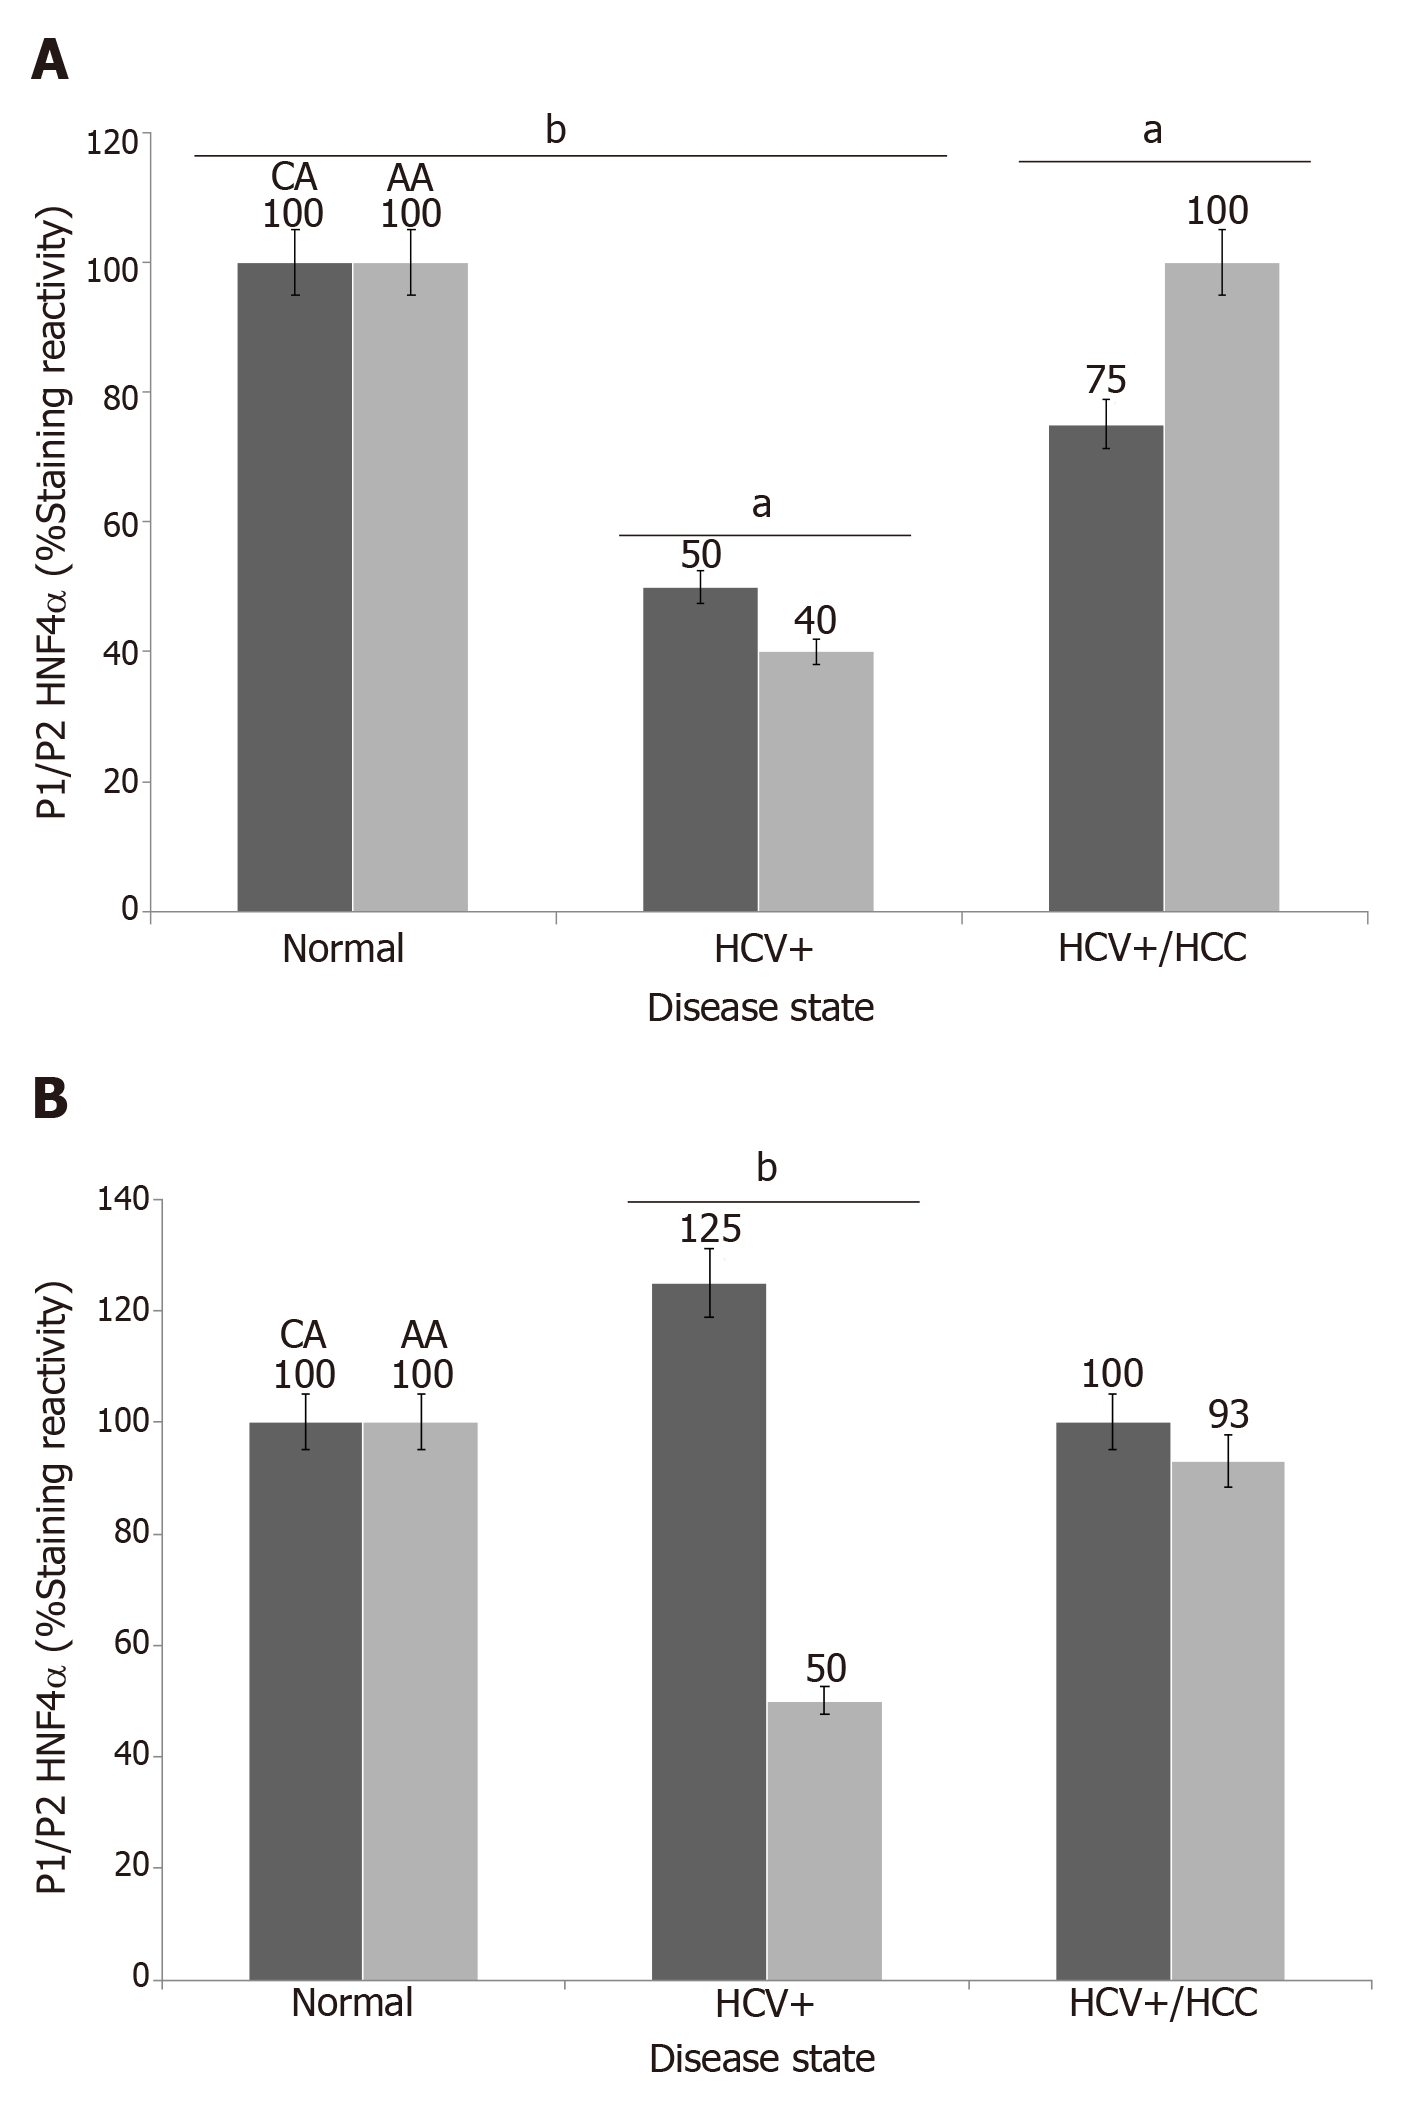
Figure 4 Immunoreactivity of hepatocyte nuclear factor 4alpha isoforms in cirrhotic and hepatocellular carcinoma livers.
Data are presented as the mean ± standard error (n=4 tissue sections from 24 paraffin embedded tissue blocks). Data were evaluated for stastistical significance by one-way analysis of variance and are represented as follows: aP<0.05, bP<0.001as compared to normal for P1/P2 HNF4α (A) and P1- HNF4α (B). Black bar (CA) = Caucasian Americans; Gray bar (AA) = African Americans, as published in[27]
- Citation: Yeh MM, Bosch DE, Daoud SS. Role of hepatocyte nuclear factor 4-alpha in gastrointestinal and liver diseases. World J Gastroenterol 2019; 25(30): 4074-4091
- URL: https://www.wjgnet.com/1007-9327/full/v25/i30/4074.htm
- DOI: https://dx.doi.org/10.3748/wjg.v25.i30.4074


