Copyright
©The Author(s) 2017.
World J Gastroenterol. May 14, 2017; 23(18): 3240-3251
Published online May 14, 2017. doi: 10.3748/wjg.v23.i18.3240
Published online May 14, 2017. doi: 10.3748/wjg.v23.i18.3240
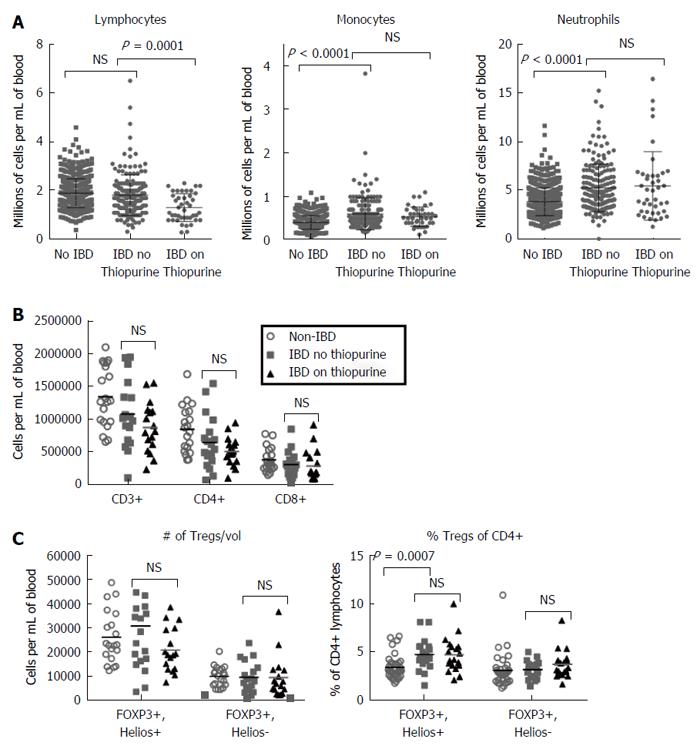
Figure 1 Thiopurine use is associated with lymphopenia, but not T cell depletion.
A: Leukocyte subsets from clinical complete blood cell differentials are shown for healthy controls and inflammatory bowel disease (IBD) patients on or not on a thiopurine medication at the time of sampling. Total (B) and regulatory (C) T cell (Treg) subsets per mL of blood were calculated from flow cytometry performed on PBMC from healthy controls (open grey circles) vs IBD patients on (black triangles) vs not on thiopurines (grey squares). Treg data is also shown as a percent of total CD4+ T cells. P values reflect two-tailed Mann-Whitney non-parametric comparisons. NS: P > 0.05.
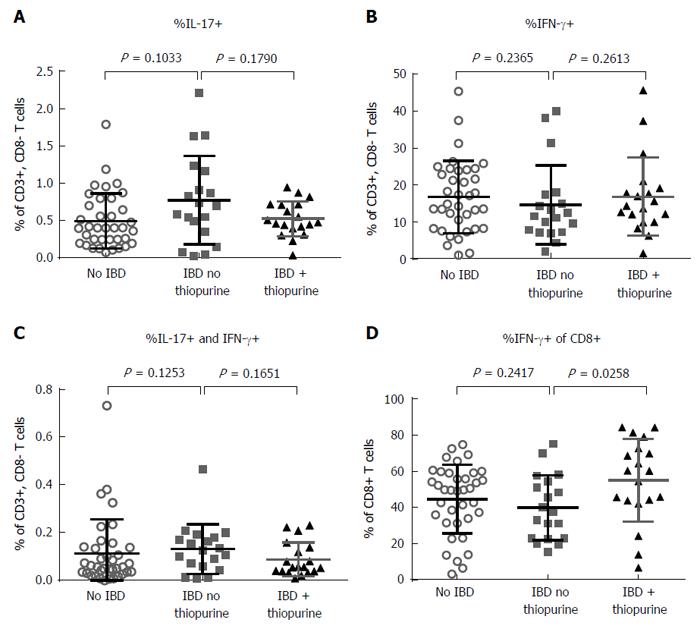
Figure 2 Thiopurines do not alter CD4+ helper T cell subsets.
Peripheral blood mononuclear cells from healthy controls (open grey circles) vs inflammatory bowel disease (IBD) patients on (black triangles) vs not on thiopurines (grey squares) were stimulated and stained for ICCS as per materials and methods. As CD4 is down-regulated in response to PMA[37], CD3+, CD8- T cells were analyzed as a surrogate for CD4 expression. The percent of such cells expressing IL-17 (A, Th17 cells), IFN-γ (B, Th1 cells) or both (C, Th1/17 cells), and the percent of CD3+, CD8+ T cells expressing IFN-γ (D) is shown for each cohort. P values reflect two-tailed Mann-Whitney non-parametric comparisons.
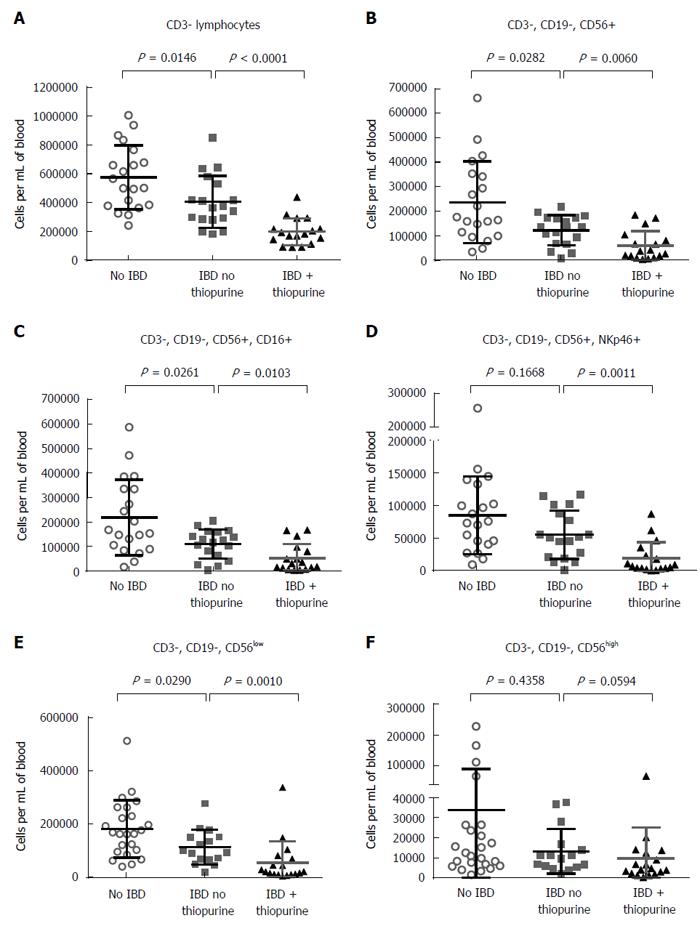
Figure 3 Thiopurine-associated lymphopenia is due to decreased NK cells.
CD3- lymphocytes (A) and CD56+, CD19- subsets thereof (B-F) per milliliter of blood were calculated from flow cytometry performed on PBMC from healthy controls (open grey circles) vs IBD patients on (black triangles) vs not on thiopurines (grey squares). Total CD56+ NK (B) and CD16+ (C), NKp46+ (D), CD56low (E), and CD56high fractions thereof are shown. P values reflect two-tailed Mann-Whitney non-parametric comparisons.
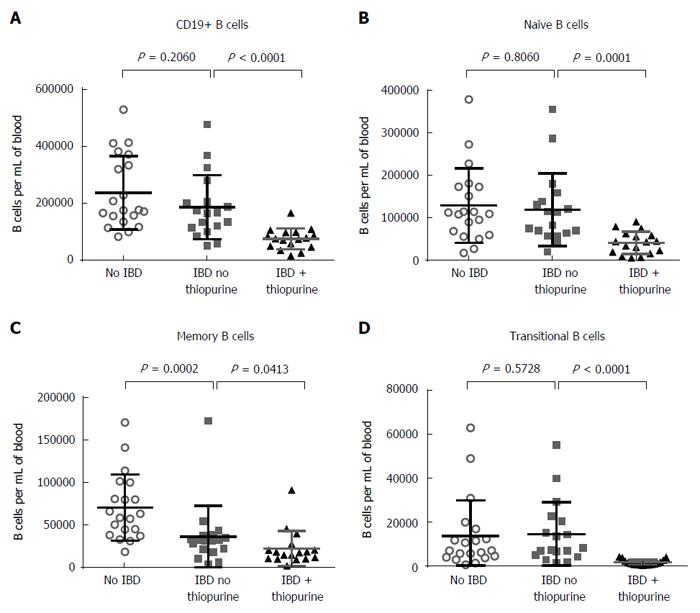
Figure 4 Thiopurine-associated lymphopenia is due to decreased B cells.
CD3-, CD19+ B cell (A) counts per ml of blood were compared between cohorts, as were CD19+, CD27-, IgD+, CD38- naïve B cells (B), CD19+, CD27+, IgD-, CD20+, CD38- memory B cells (C), and CD19+, CD27-, IgD+, CD38+ transitional B cells (D). P values reflect two-tailed Mann-Whitney non-parametric comparisons.
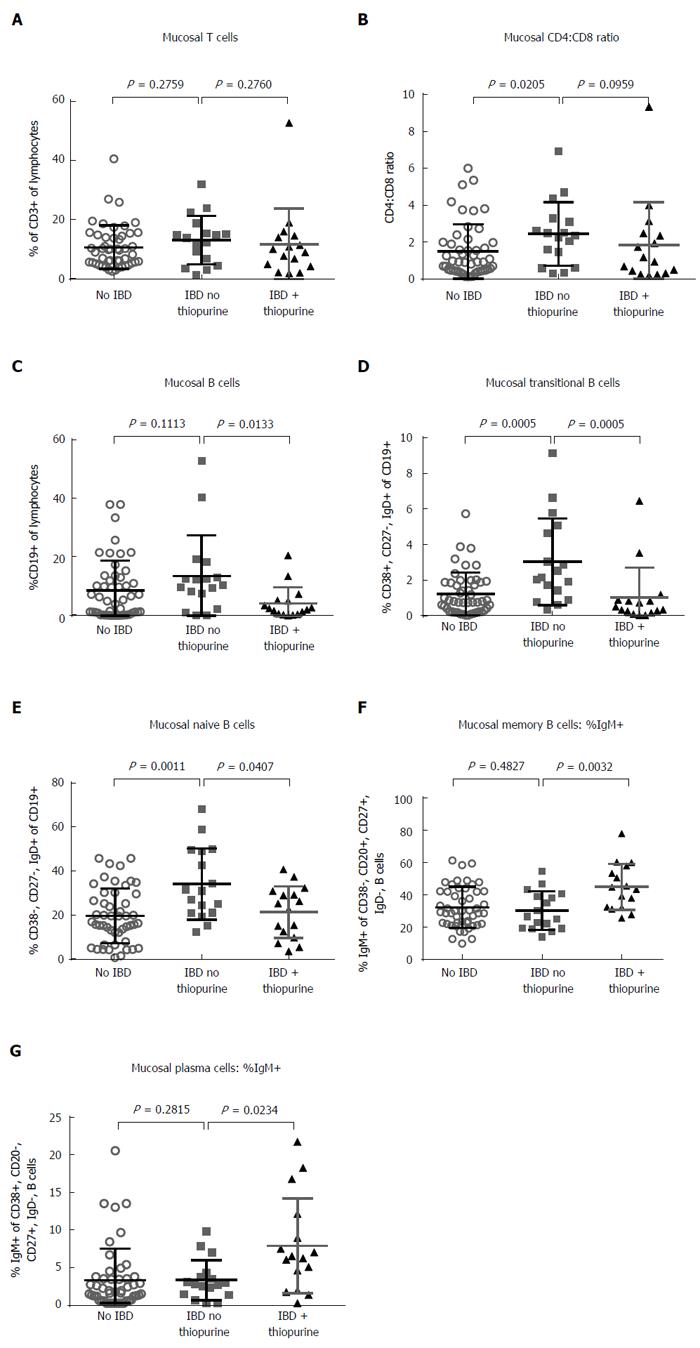
Figure 5 Intestinal B, but not T cells, are reduced in thiopurine recipients.
Collagenase-digested colon biopsies from healthy controls (open grey circles) vs inflammatory bowel disease patients on (black triangles) vs not on thiopurines (grey squares) underwent flow cytometry. The percent of lymphocytes expressing the T cell marker CD3 (A) and the CD4:CD8 ratio thereof (B) is shown for each cohort. The percent of lymphocytes expressing the B cell marker CD19 (C) and the CD27-, CD38+, IgD+ or CD27-, CD38-, IgD+ fractions thereof resembling transitional (D) and naïve (E) B cells, respectively, are shown. The fraction of CD27+, IgD-, CD20+, CD38- memory B cells (F) and CD27+, CD38+, CD20-, IgD- plasma cells (G) expressing surface IgM is shown. P values reflect two-tailed Mann-Whitney non-parametric comparisons.
- Citation: Lord JD, Shows DM. Thiopurine use associated with reduced B and natural killer cells in inflammatory bowel disease. World J Gastroenterol 2017; 23(18): 3240-3251
- URL: https://www.wjgnet.com/1007-9327/full/v23/i18/3240.htm
- DOI: https://dx.doi.org/10.3748/wjg.v23.i18.3240


