Copyright
©The Author(s) 2015.
World J Gastroenterol. Feb 14, 2015; 21(6): 1749-1758
Published online Feb 14, 2015. doi: 10.3748/wjg.v21.i6.1749
Published online Feb 14, 2015. doi: 10.3748/wjg.v21.i6.1749
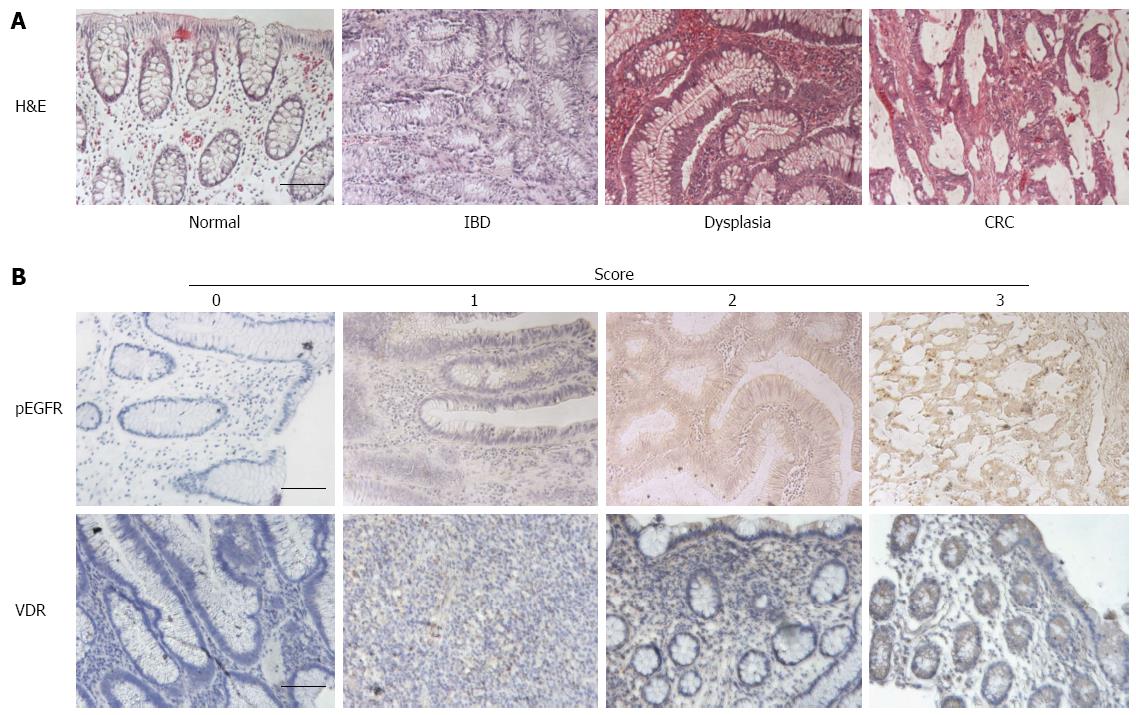
Figure 1 Histologic images depicting stages in the colitis-dysplasia-cancer progression of colitis-associated cancer.
A: Colitis-associated colorectal cancer (CAC) is thought to arise through the chronic colitis-dysplasia-carcinoma sequence; B: Examples of immunohistochemistry scoring for phosphorylated epidermal growth factor receptor (pEGFR; top row) and vitamin D receptor (VDR; bottom row). A score of 0 indicates minimal or absent staining, whereas a score of 3 indicates strongest staining for a particular antibody. For pEGFR, the pictures scored as 0, 1, 2, and 3 correspond to tissues with a diagnosis of normal, inflammatory bowel disease (IBD), sporadic dysplasia, and sporadic colorectal cancer (CRC), respectively. For VDR, the pictures scored as 0, 1, 2, and 3 correspond to tissues with a diagnosis of sporadic dysplasia, sporadic colorectal cancer, IBD, and normal, respectively. Scale bars = 100 μm.
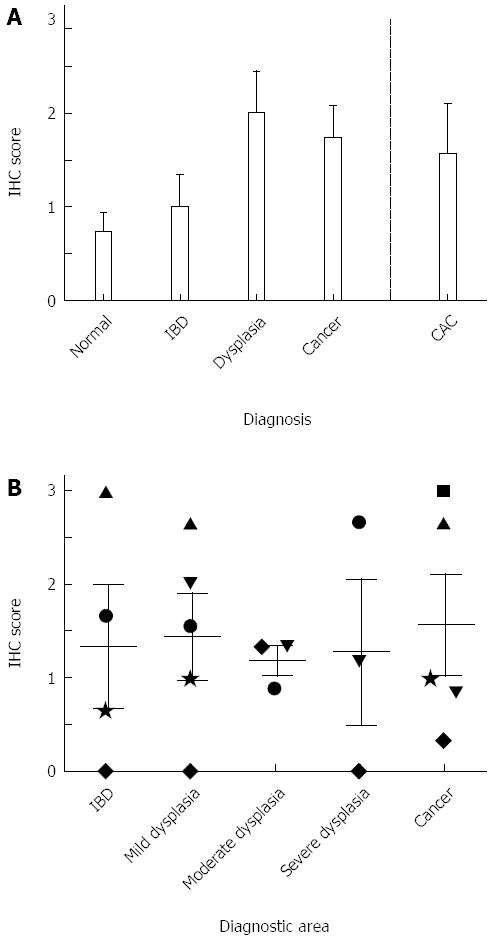
Figure 2 Expression of neurokinin-1 receptor in colonic tissue.
A: Neurokinin-1 receptor (NK-1R) expression in tissue from normal, inflammatory bowel disease (IBD), sporadic dysplasia, sporadic colorectal cancer, and colitis-associated colorectal cancer (CAC) patients (n = 5 patients per group); B: Expression of NK-1R in different diagnostic areas found within tissue from CAC patients. Each patient is identified by a unique symbol (Table 2). IHC: Immunohistochemistry.
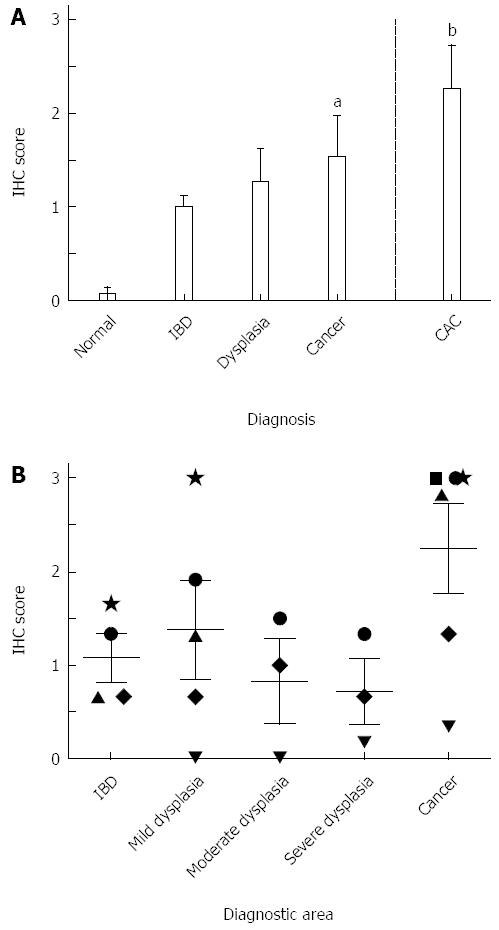
Figure 3 Expression of phosphorylated epidermal growth factor receptor in colonic tissue.
A: Phosphorylated epidermal growth factor receptor (pEGFR) expression in tissue from normal, inflammatory bowel disease (IBD), sporadic dysplasia, sporadic colorectal cancer, and colitis-associated colorectal cancer (CAC) patients (n = 5 patients per group except CAC, where n = 6). aP < 0.05 and bP < 0.01 vs normal; B: Expression of pEGFR in different diagnostic areas found within tissue from CAC patients. Each patient is identified by a unique symbol (see Table 2). IHC: Immunohistochemistry.
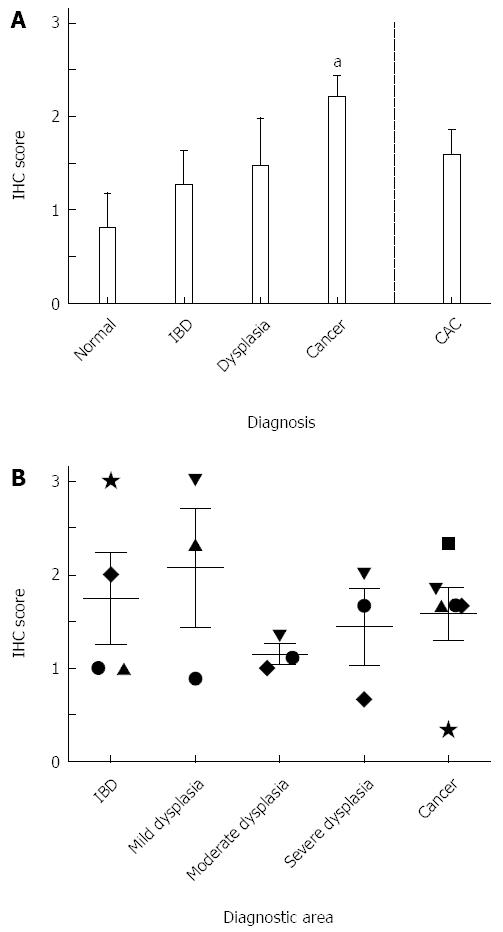
Figure 4 Expression of cyclooxygenase-2 in colonic tissue.
A: Cyclooxygenase-2 (Cox-2) expression in tissue from normal, inflammatory bowel disease (IBD), sporadic dysplasia, sporadic colorectal cancer, and colitis-associated colorectal cancer (CAC) patients (n = 5 patients per group except CAC, where n = 6). aP < 0.05 vs normal; B: Expression of Cox-2 in different diagnostic areas found within tissue from CAC patients. Each patient is identified by a unique symbol (Table 2). IHC: Immunohistochemistry.
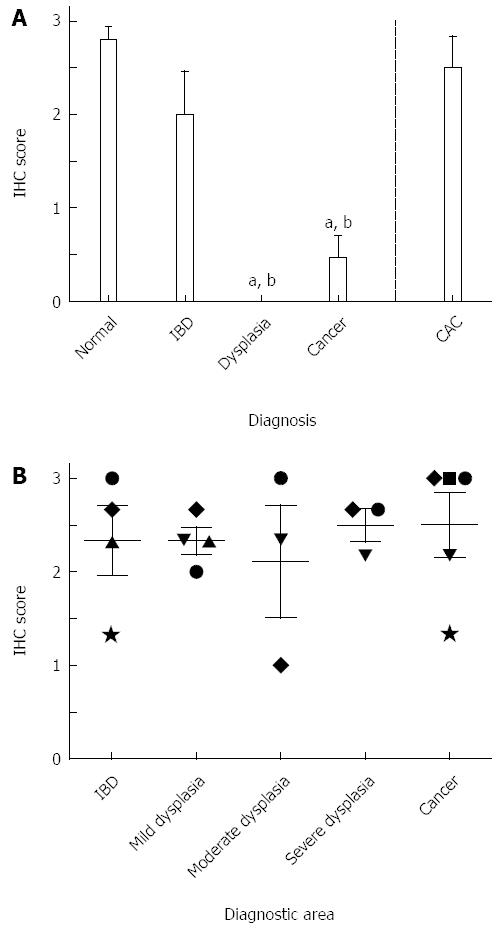
Figure 5 Expression of vitamin D receptor in colonic tissue.
A: Vitamin D receptor (VDR) expression in tissue from normal, inflammatory bowel disease (IBD), sporadic dysplasia, sporadic colorectal cancer, and colitis-associated colorectal cancer (CAC) patients (n = 5 patients per group except CAC, where n = 6). aP < 0.001 vs normal and bP < 0.001 vs CAC; B: Expression of VDR in different diagnostic areas found within tissue from CAC patients. Each patient is identified by a unique symbol (see Table 2). IHC: Immunohistochemistry.
- Citation: Isidro RA, Cruz ML, Isidro AA, Baez A, Arroyo A, González-Marqués WA, González-Keelan C, Torres EA, Appleyard CB. Immunohistochemical expression of SP-NK-1R-EGFR pathway and VDR in colonic inflammation and neoplasia. World J Gastroenterol 2015; 21(6): 1749-1758
- URL: https://www.wjgnet.com/1007-9327/full/v21/i6/1749.htm
- DOI: https://dx.doi.org/10.3748/wjg.v21.i6.1749


