Copyright
©2013 Baishideng Publishing Group Co.
World J Gastroenterol. Aug 21, 2013; 19(31): 5094-5102
Published online Aug 21, 2013. doi: 10.3748/wjg.v19.i31.5094
Published online Aug 21, 2013. doi: 10.3748/wjg.v19.i31.5094
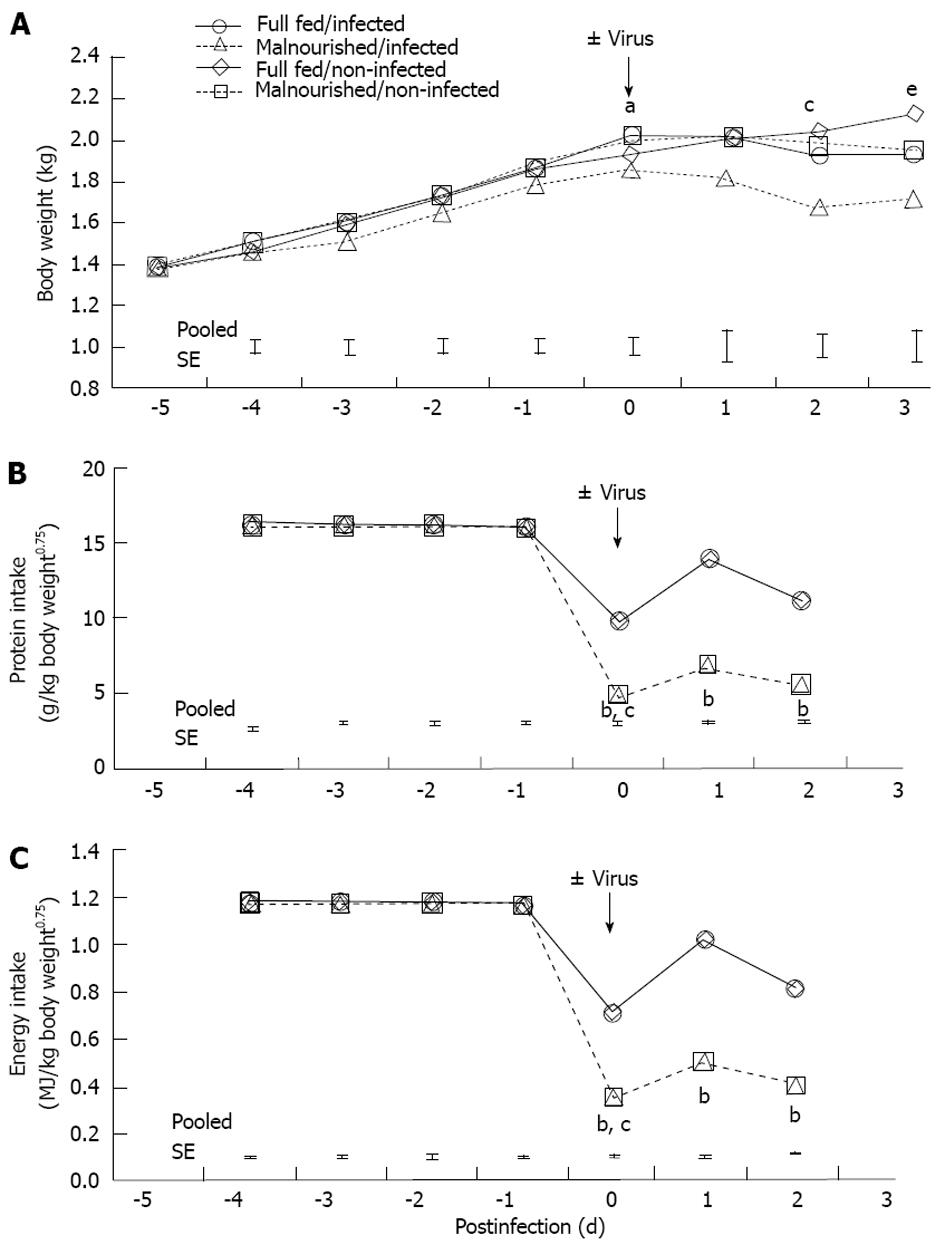
Figure 1 Growth, protein intake and metabolizable energy intake of newborn pigs fed full-strength formula (full fed) or half-strength formula (malnourished) and inoculated with rotavirus or vehicle (non-infected) as indicated.
Values are reported as least-square means (n = 6/treatment), and error bars represent ± pooled SE per day. A: Piglet growth curves, calculated using initial body weight as a covariate. aP < 0.05, feeding-level/rotavirus interaction; cP < 0.05, feeding-level; eP < 0.05, rotavirus effect; B, C: Protein intakes (B) and metabolizable energy intakes (C) of newborn pigs over time. Non-infected pigs were pair-fed to their rotavirus-infected counterparts. bP < 0.01, feeding level effect; cP < 0.05, rotavirus effect.
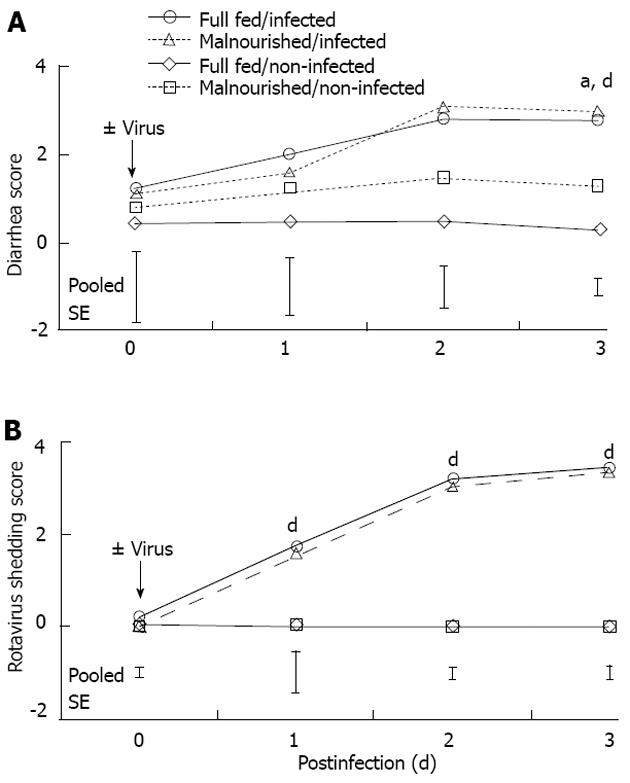
Figure 2 Daily diarrhea (A) and rotavirus shedding scores (B) measured in newborn pigs fed full-strength formula (full fed) or half-strength formula (malnourished) and inoculated with rotavirus or vehicle (non-infected) as indicated.
Values are reported as least-square mean (n = 6/treatment), and error bars represent ± pooled SE per day. aP < 0.05, feeding level effect; dP < 0.01, rotavirus effect.
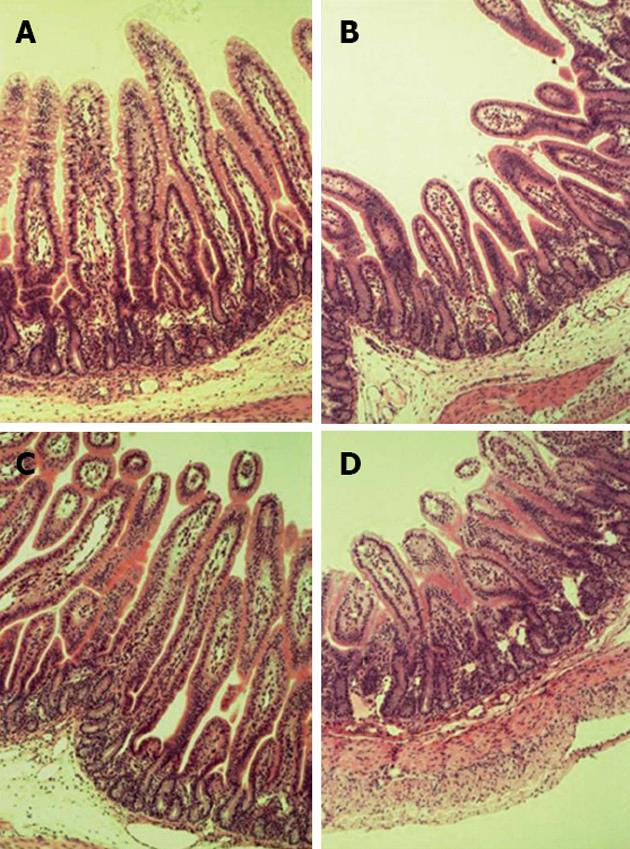
Figure 3 Hematoxylin and eosin stained intestinal sections from newborn pigs fed full-strength formula (full fed; A and B) or half-strength formula (malnourished; C and D) and inoculated with rotavirus (B and D) or vehicle (non-infected; A and C) as indicated (× 10 magnification).
Numerical measurements and statistical analysis of the intestinal morphology are reported in Table 1.
Figure 4 Transepithelial electrical resistance (A) and 3H-mannitol flux (B) in jejunal mucosa from new-born pigs fed full-strength formula (full fed) or half-strength formula (malnourished) and inoculated with rotavirus or vehicle (non-infected) as indicated.
Measurements were made 3 d post-inoculation. Values are reported as least-square means (n = 6/treatment), and error bars represent pooled SE. aP < 0.05, cP < 0.05 between groups.
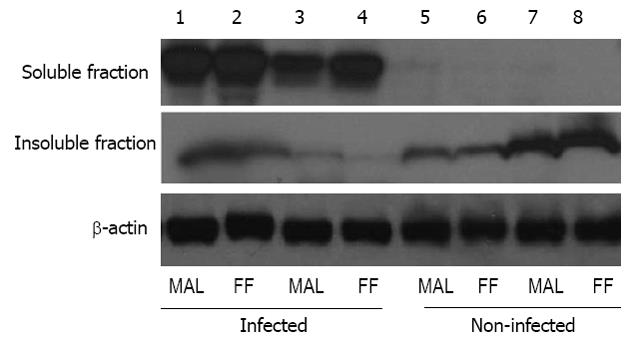
Figure 5 Occludin Western blotting analysis of jejunal tissues from newborn pigs fed full-strength formula or half-strength formula and inoculated with rotavirus or vehicle as indicated.
Tissues were collected 3 d post-inoculation. Full-strength formula [full fed (FF)]: Lanes 2, 4, 6, 8; Half-strength formula [malnourished (MAL)]: Lanes 1, 3, 5, 7; Infected rotavirus: Lanes 1-4; Non-infected vehicle: Lanes 5-8; Upper panel: Soluble protein.
- Citation: Jacobi SK, Moeser AJ, Blikslager AT, Rhoads JM, Corl BA, Harrell RJ, Odle J. Acute effects of rotavirus and malnutrition on intestinal barrier function in neonatal piglets. World J Gastroenterol 2013; 19(31): 5094-5102
- URL: https://www.wjgnet.com/1007-9327/full/v19/i31/5094.htm
- DOI: https://dx.doi.org/10.3748/wjg.v19.i31.5094


