Copyright
©2010 Baishideng.
World J Gastroenterol. Apr 21, 2010; 16(15): 1916-1923
Published online Apr 21, 2010. doi: 10.3748/wjg.v16.i15.1916
Published online Apr 21, 2010. doi: 10.3748/wjg.v16.i15.1916
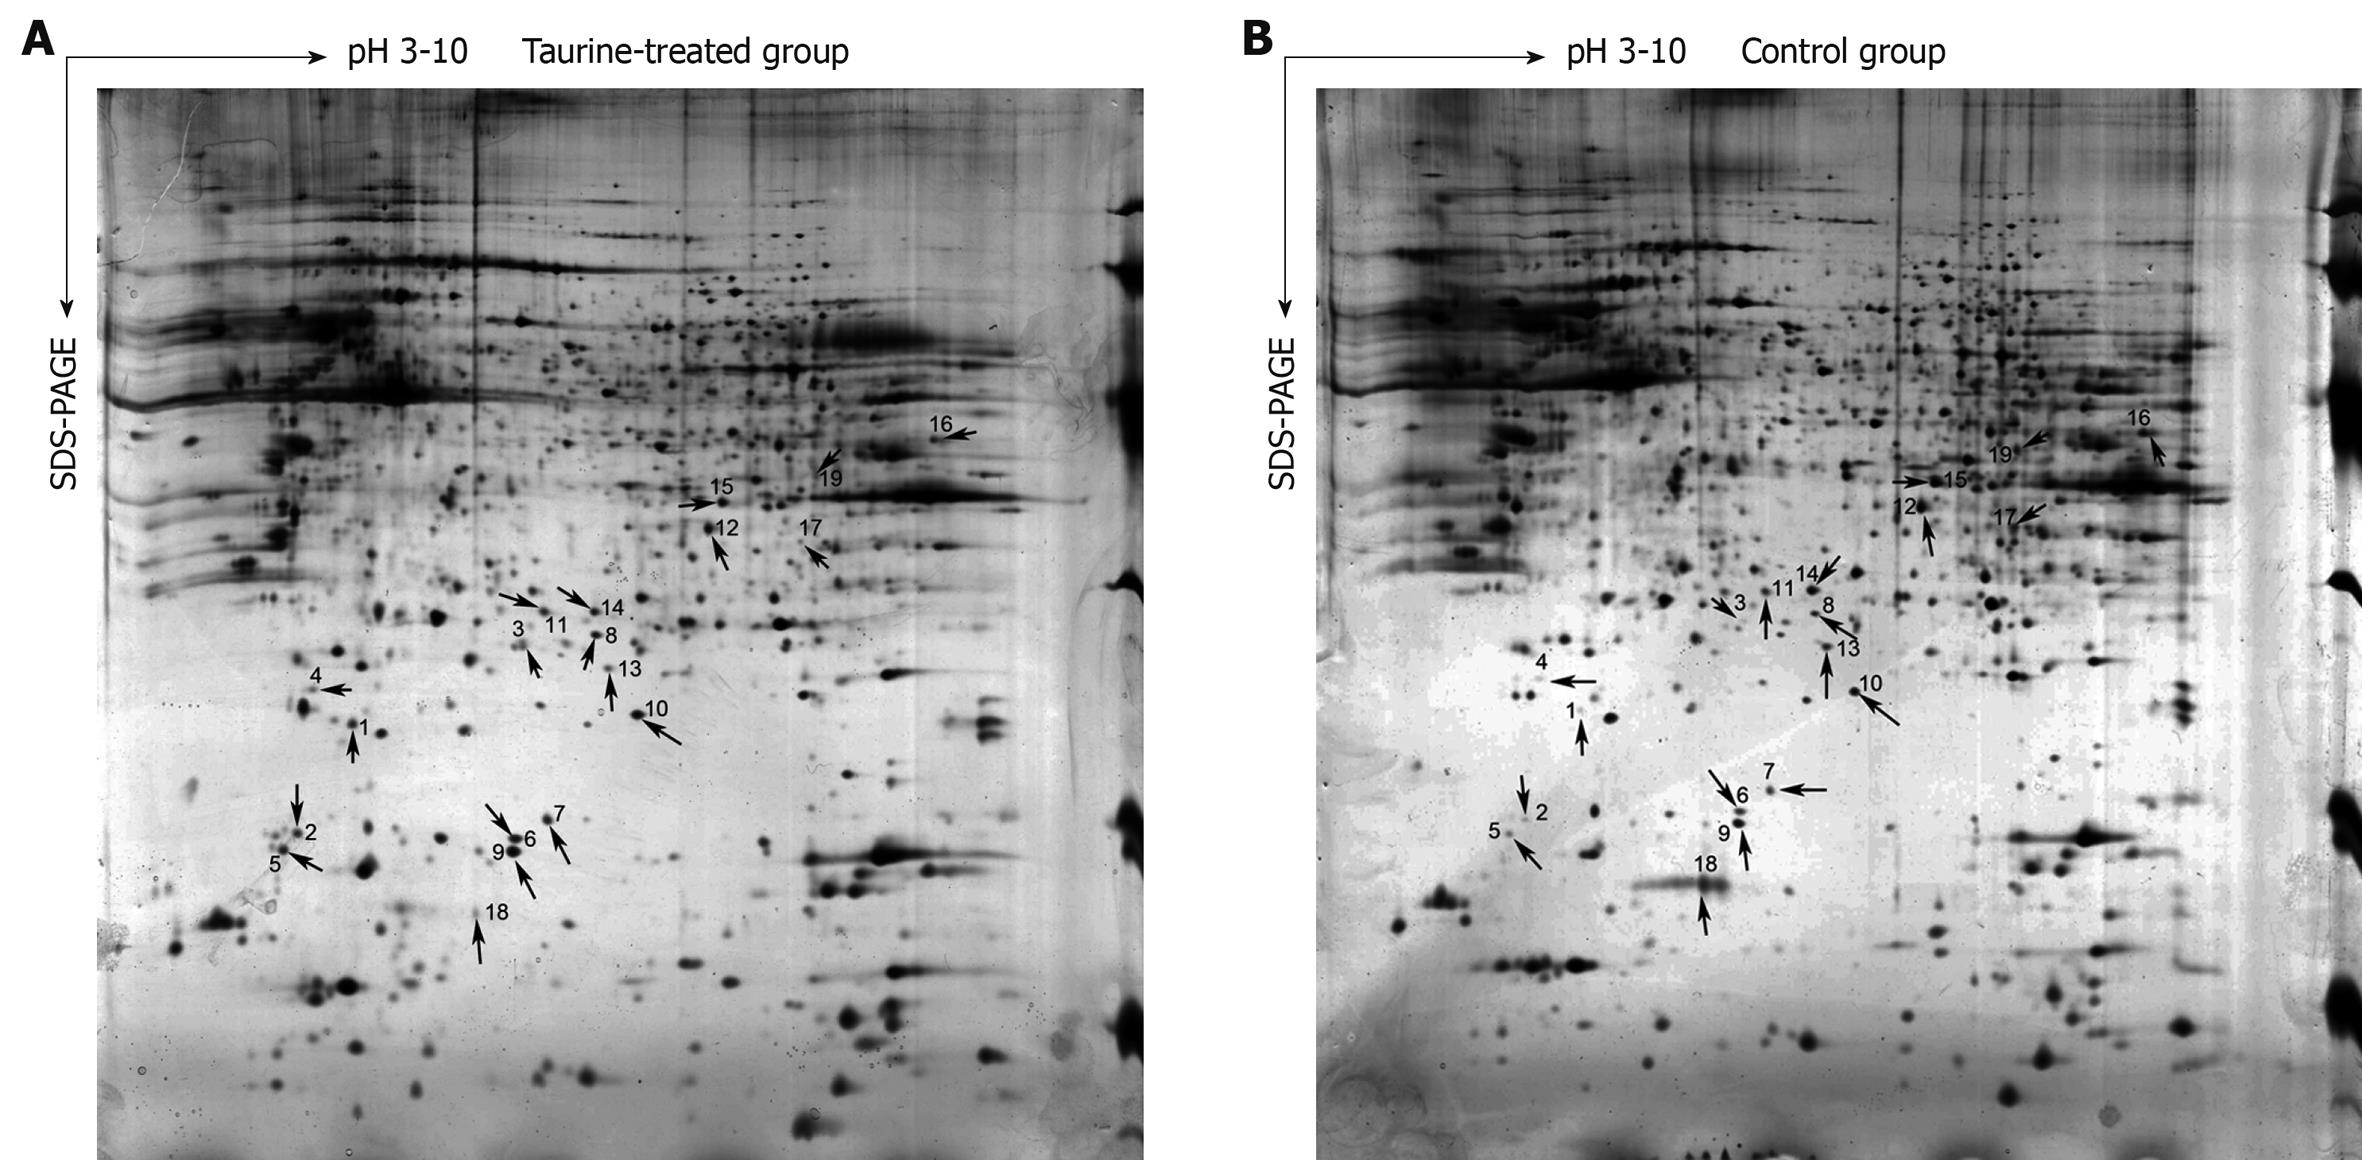
Figure 1 Two-dimensional gel electrophoresis (2-DE) images of taurine-treated hepatic stellate cells (HSCs) and controls.
A: Taurine-treated group; B: Control group. In both images, transverse arrows represent isoelectric focusing and longitudinal ones represent sodium dodecyl sulfate-polyacrylamide gel electrophoresis (SDS-PAGE).
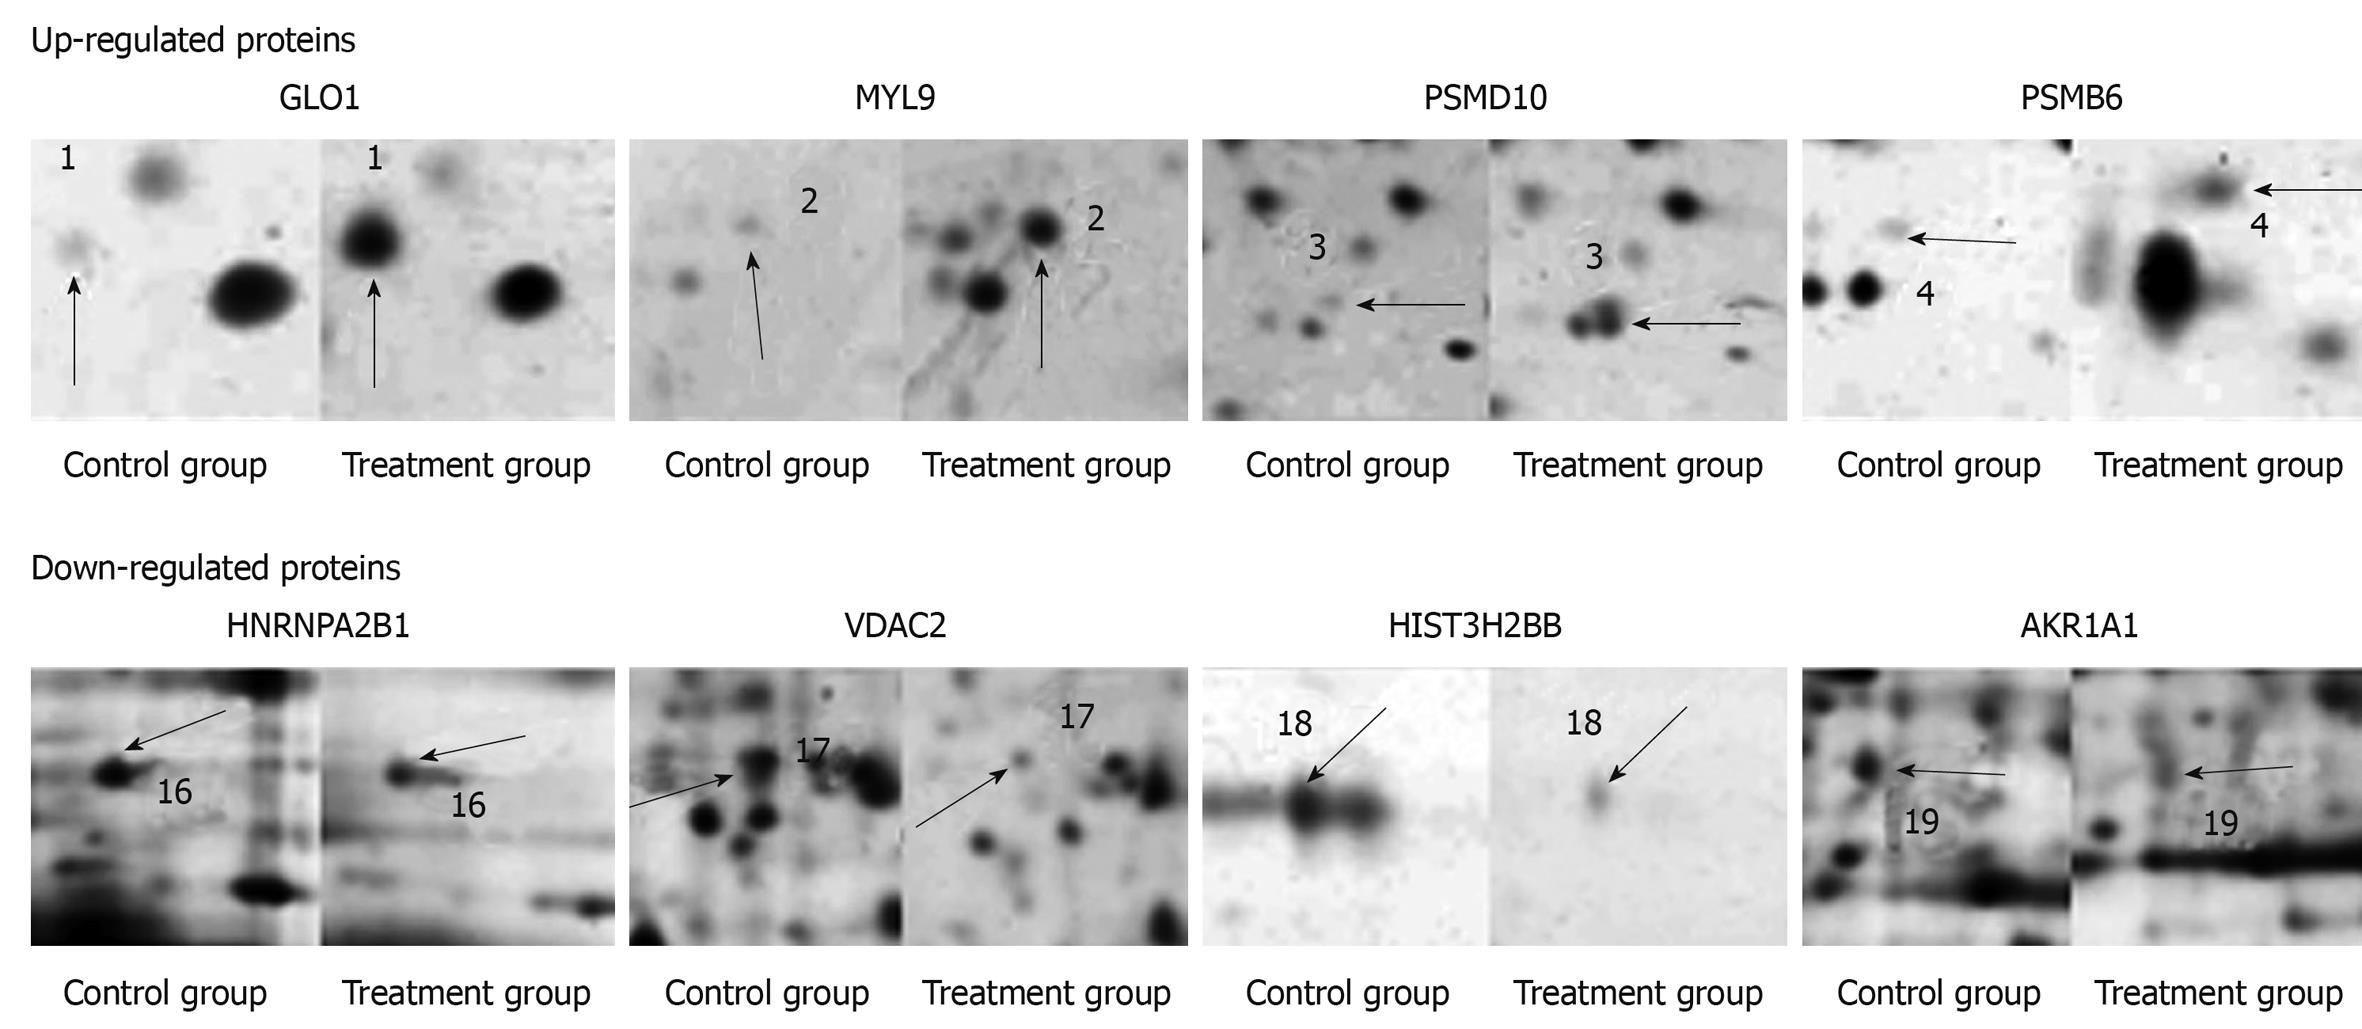
Figure 2 Local amplification of some differentially expressed protein spots (arrows).
Up-regulated: GLO1, MYL9, PSMD10 and PSMB6, and down-regulated: HNRNPA2B1, VDAC2, HIST2H2BB and AKR1A1.
Figure 3 Results of validation by Western blotting for differentially expressed proteins.
GAPDH was used as an internal reference. The experiment was repeated 4 times for each protein. Four columns in the right side represent the control group and the other 4 columns in the left side are from the taurine-treated group.
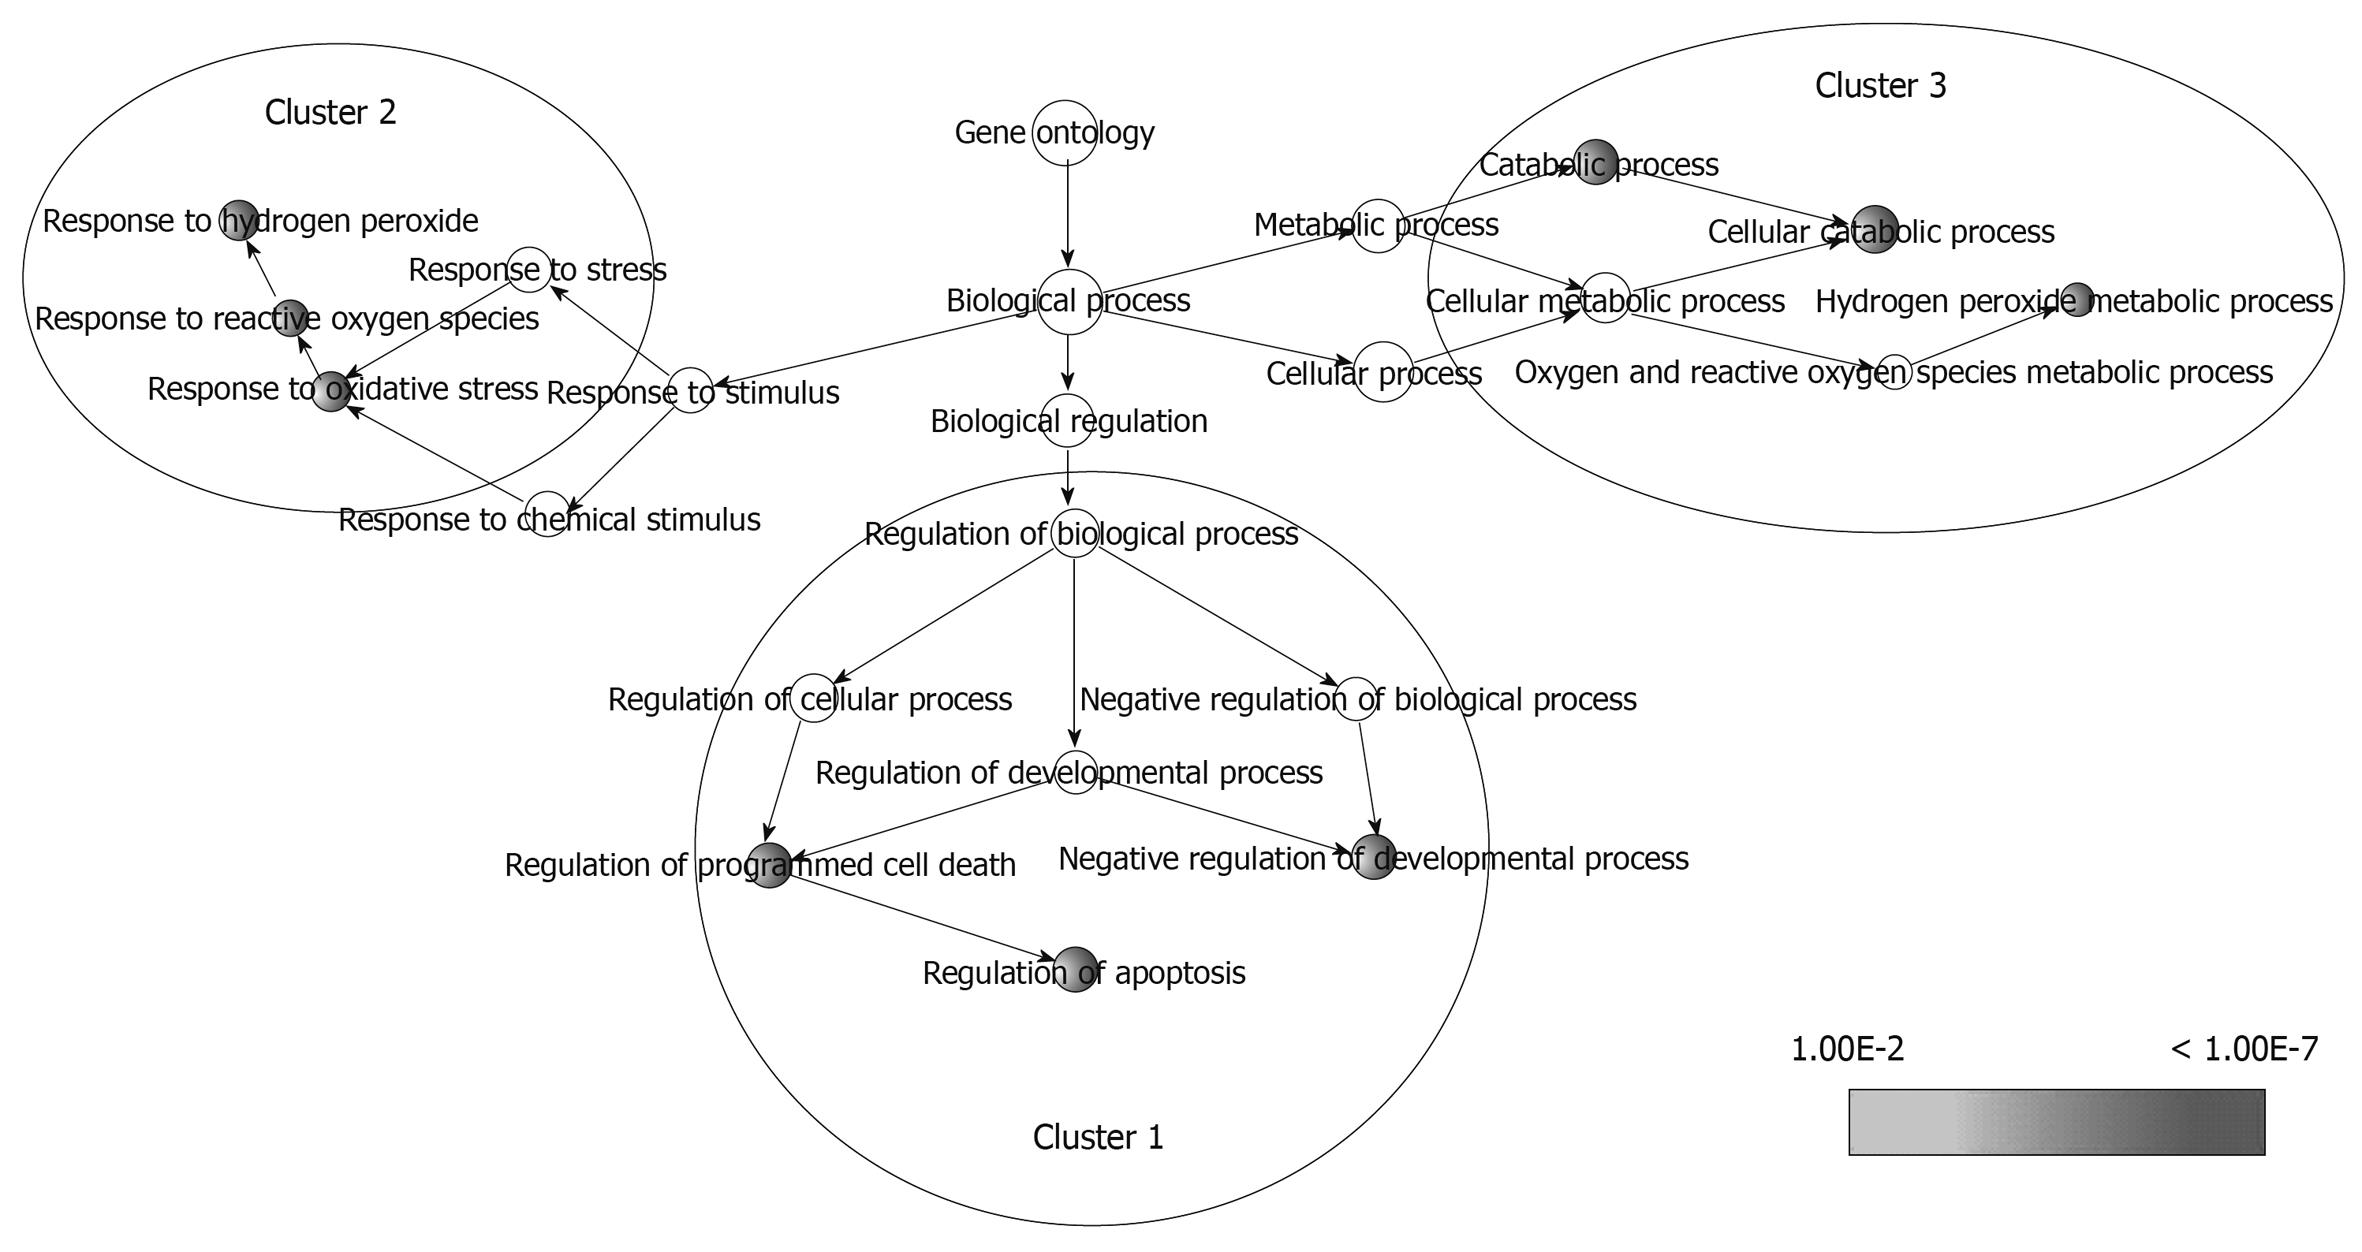
Figure 4 Network diagram of functional categorization of differentially expressed proteins.
The categories in this tree structure fully correspond to the 3 categories in Table 2 and the depth of color ranging from light to dark gray indicates the significance level of FDR in Table 2. Gray nodes represent significantly enriched GO terms and white nodes signify GO terms that have a parent/child relationship with gray nodes. Connecting lines between nodes construct a directional hierarchy of the GO terms.
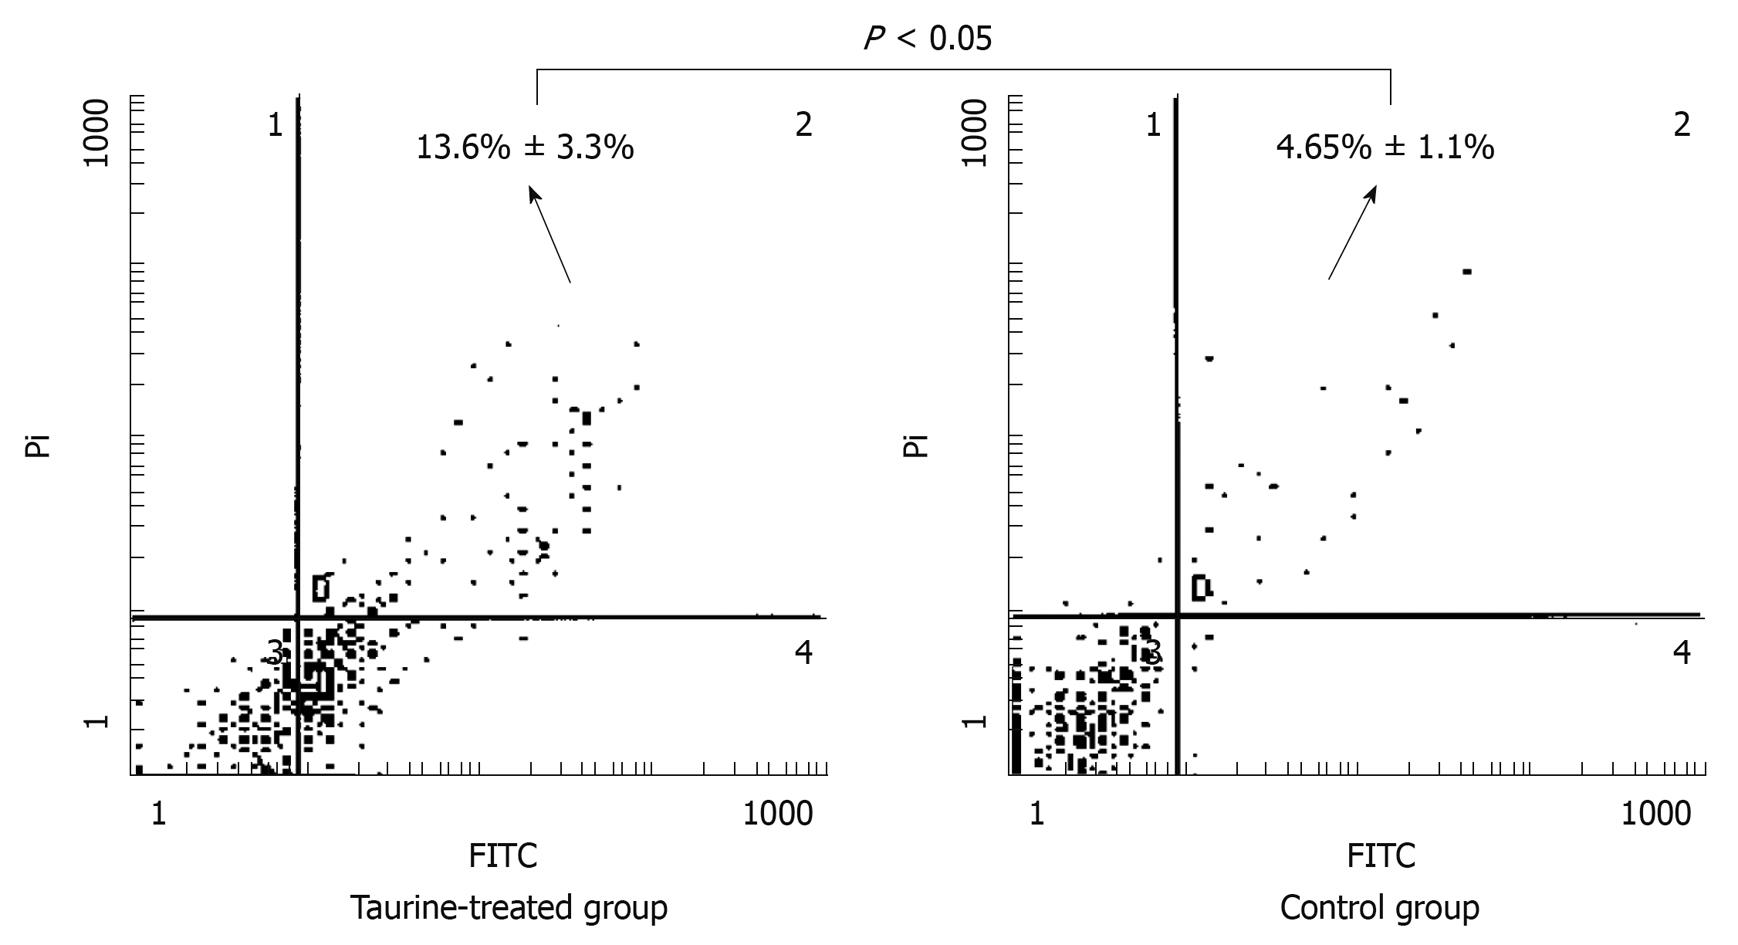
Figure 5 Apoptosis profiles of HSCs treated or untreated with taurine.
The experiment was repeated 3 times for each sample (t test, P < 0.05). Cell count in the second quadrant was used to calculate the apoptosis rate.
- Citation: Deng X, Liang J, Lin ZX, Wu FS, Zhang YP, Zhang ZW. Natural taurine promotes apoptosis of human hepatic stellate cells in proteomics analysis. World J Gastroenterol 2010; 16(15): 1916-1923
- URL: https://www.wjgnet.com/1007-9327/full/v16/i15/1916.htm
- DOI: https://dx.doi.org/10.3748/wjg.v16.i15.1916


