Copyright
©The Author(s) 2024.
Artif Intell Med Imaging. Sep 28, 2024; 5(1): 93993
Published online Sep 28, 2024. doi: 10.35711/aimi.v5.i1.93993
Published online Sep 28, 2024. doi: 10.35711/aimi.v5.i1.93993
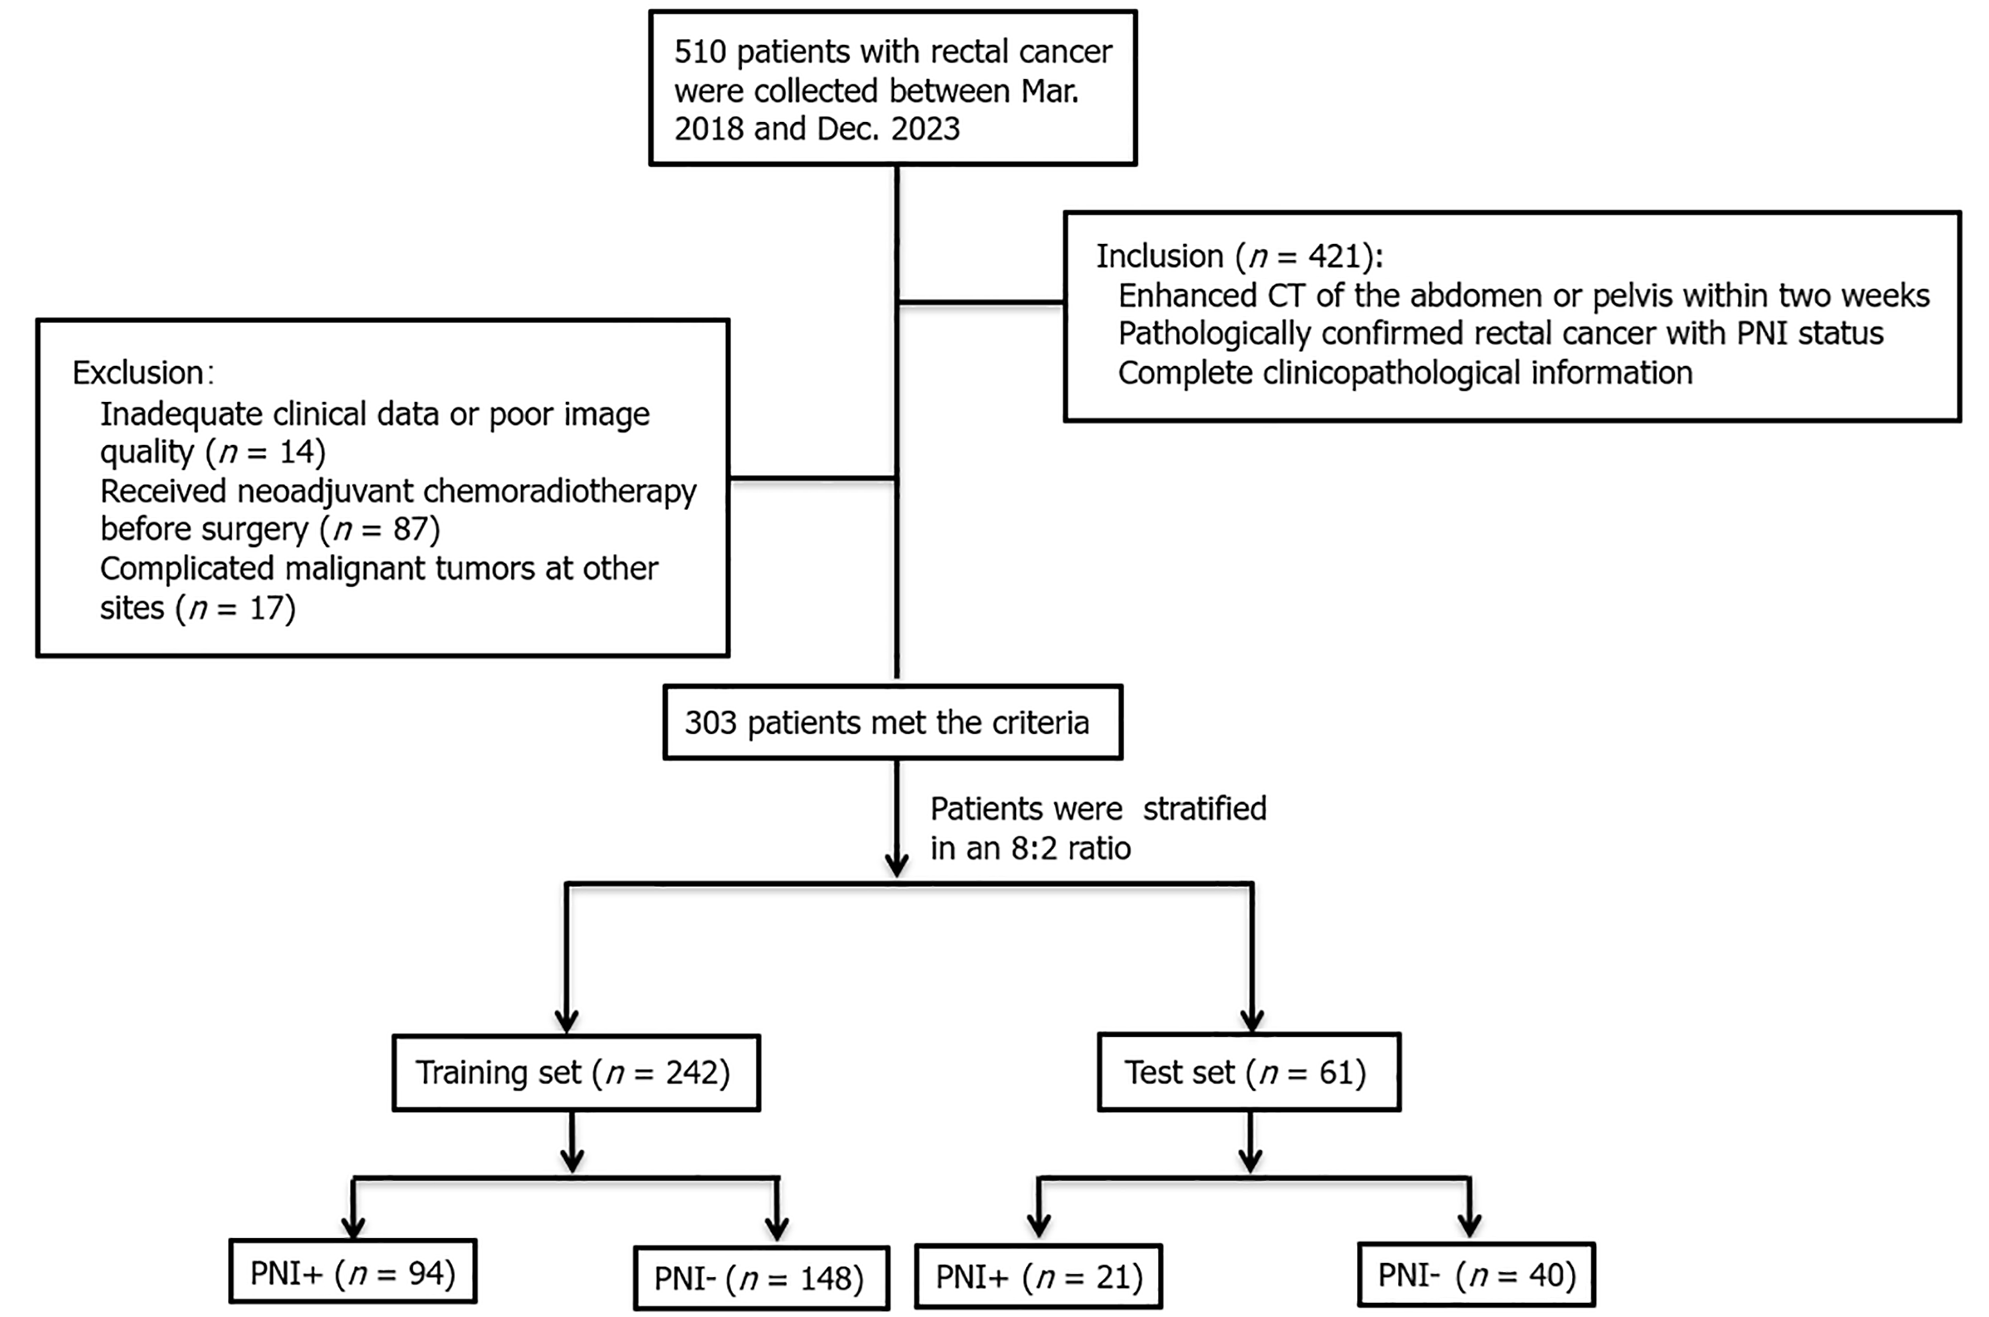
Figure 1 Flow chart of patient recruitment.
CT: Computed tomography; PNI: Perineural invasion.
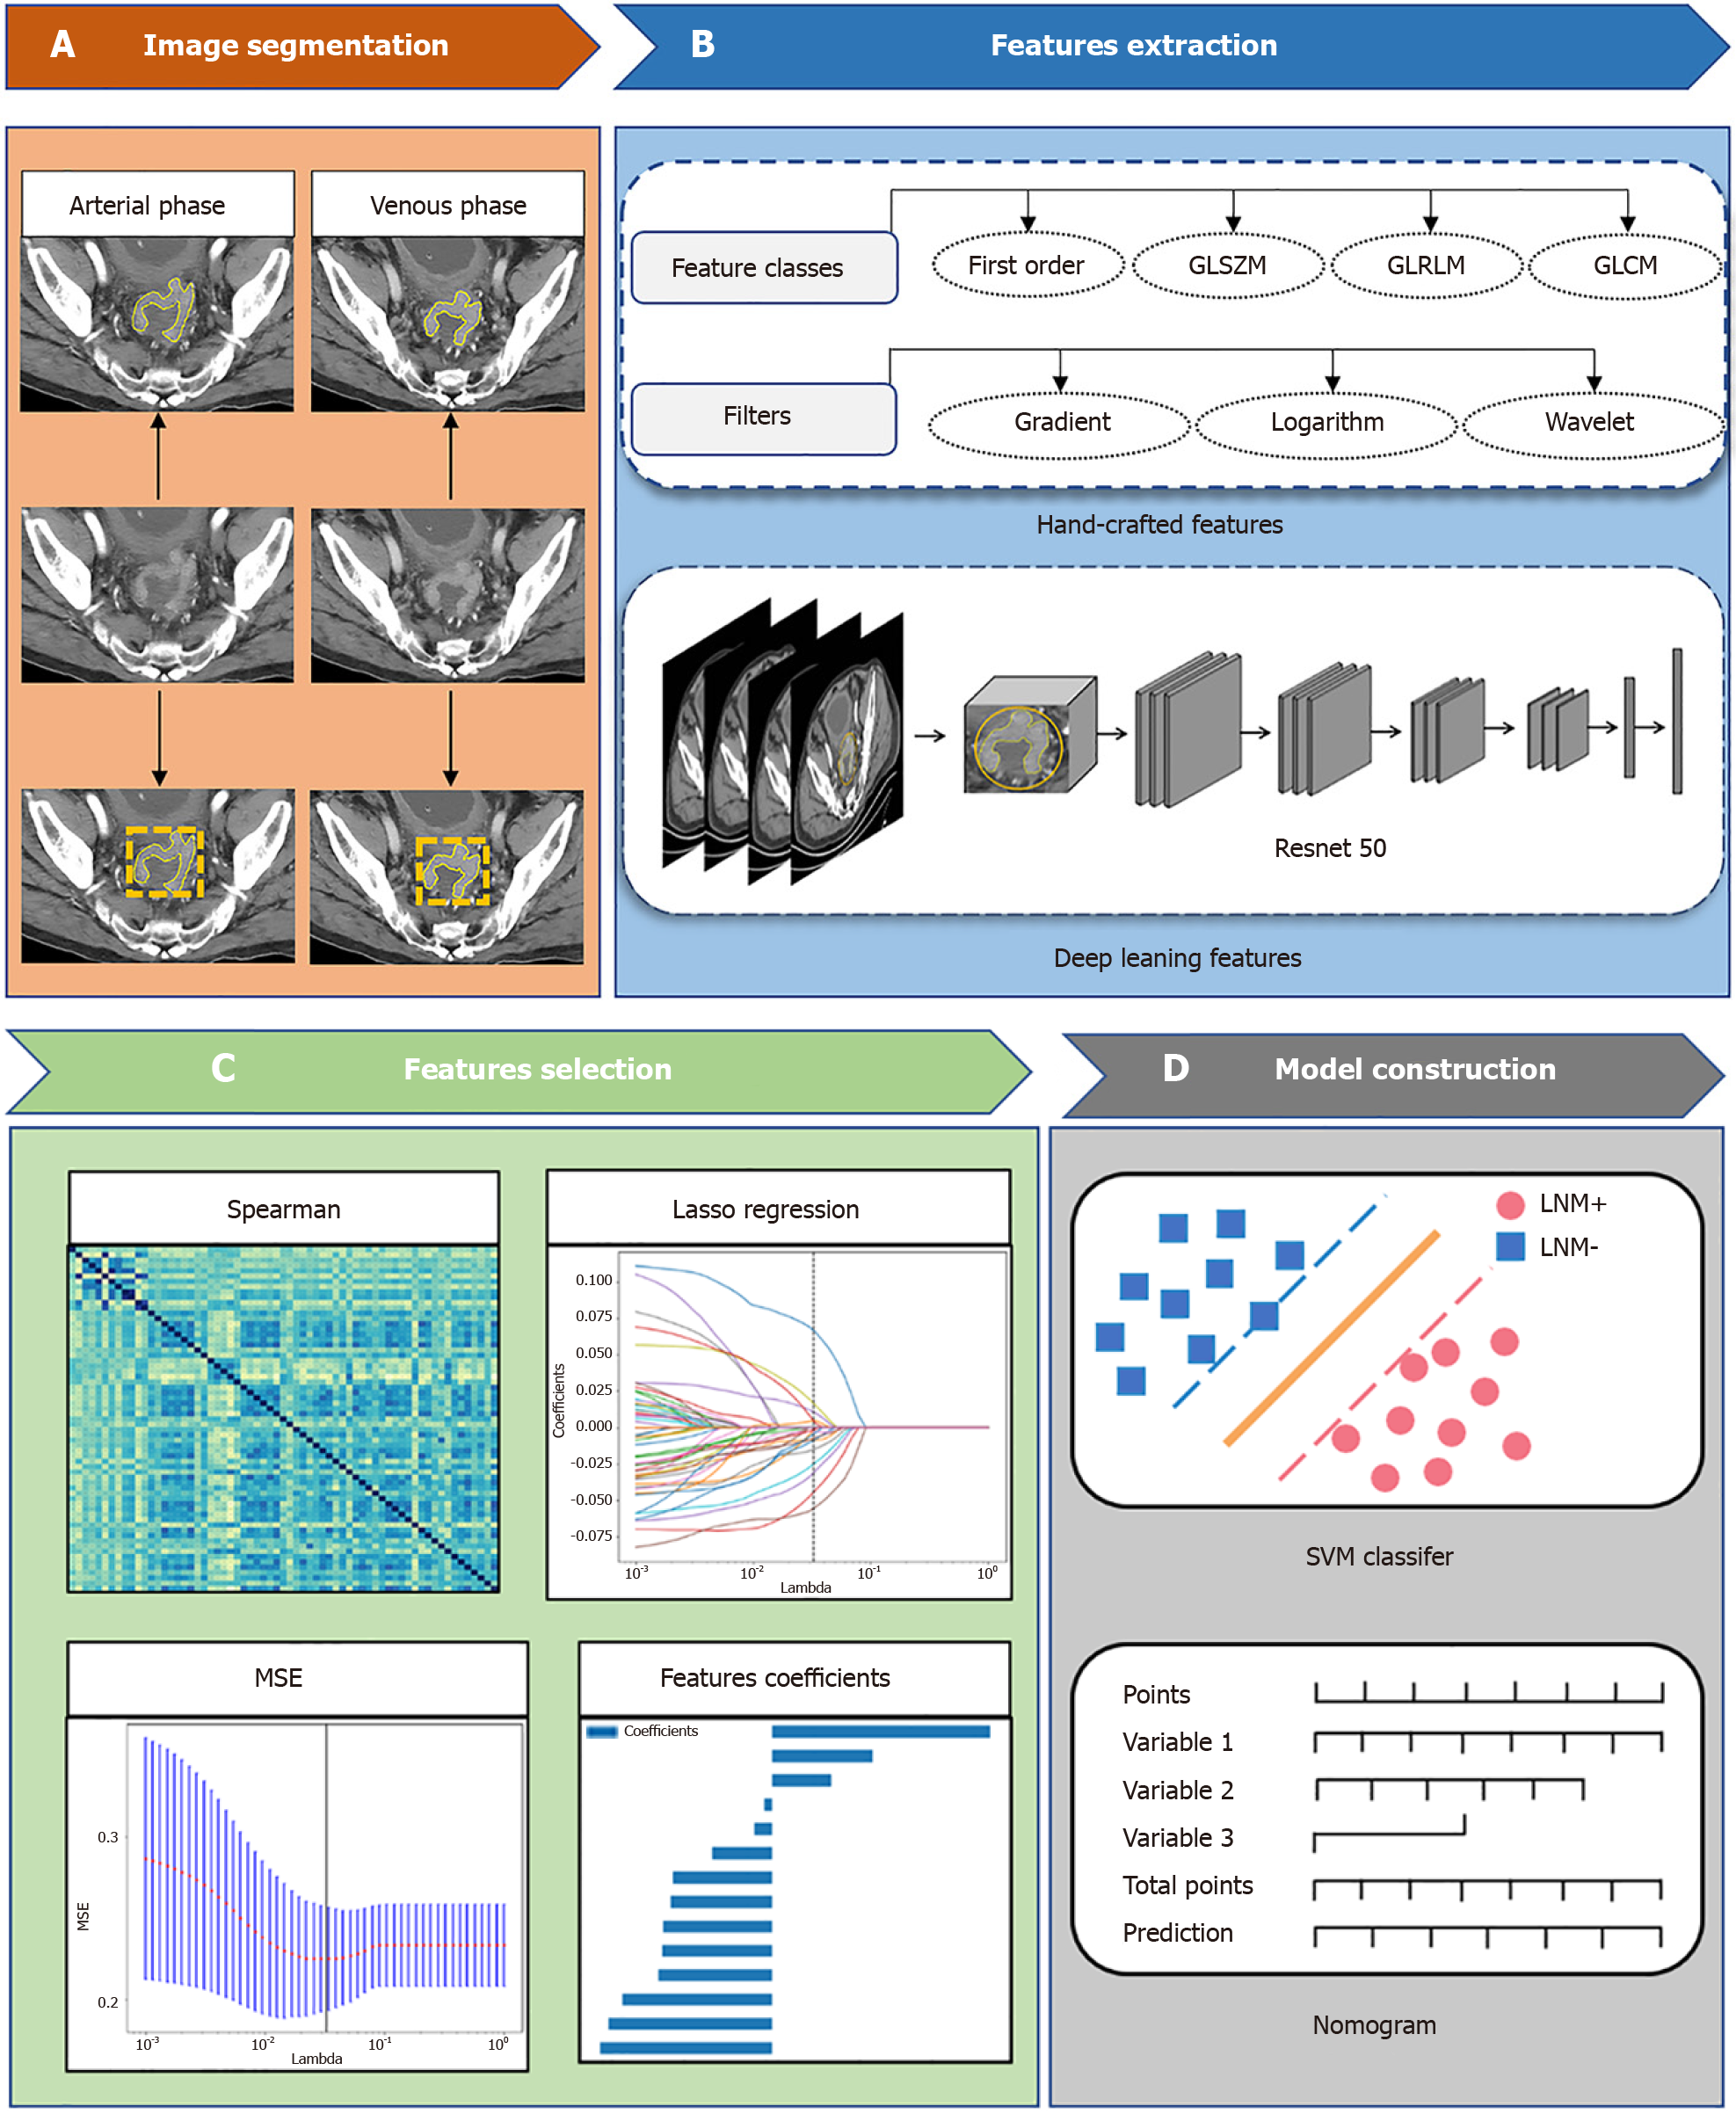
Figure 2 Demonstration of radiomics model construction.
A: Image segmentation; B: Features extraction; C: Features selection; D: Model construction.
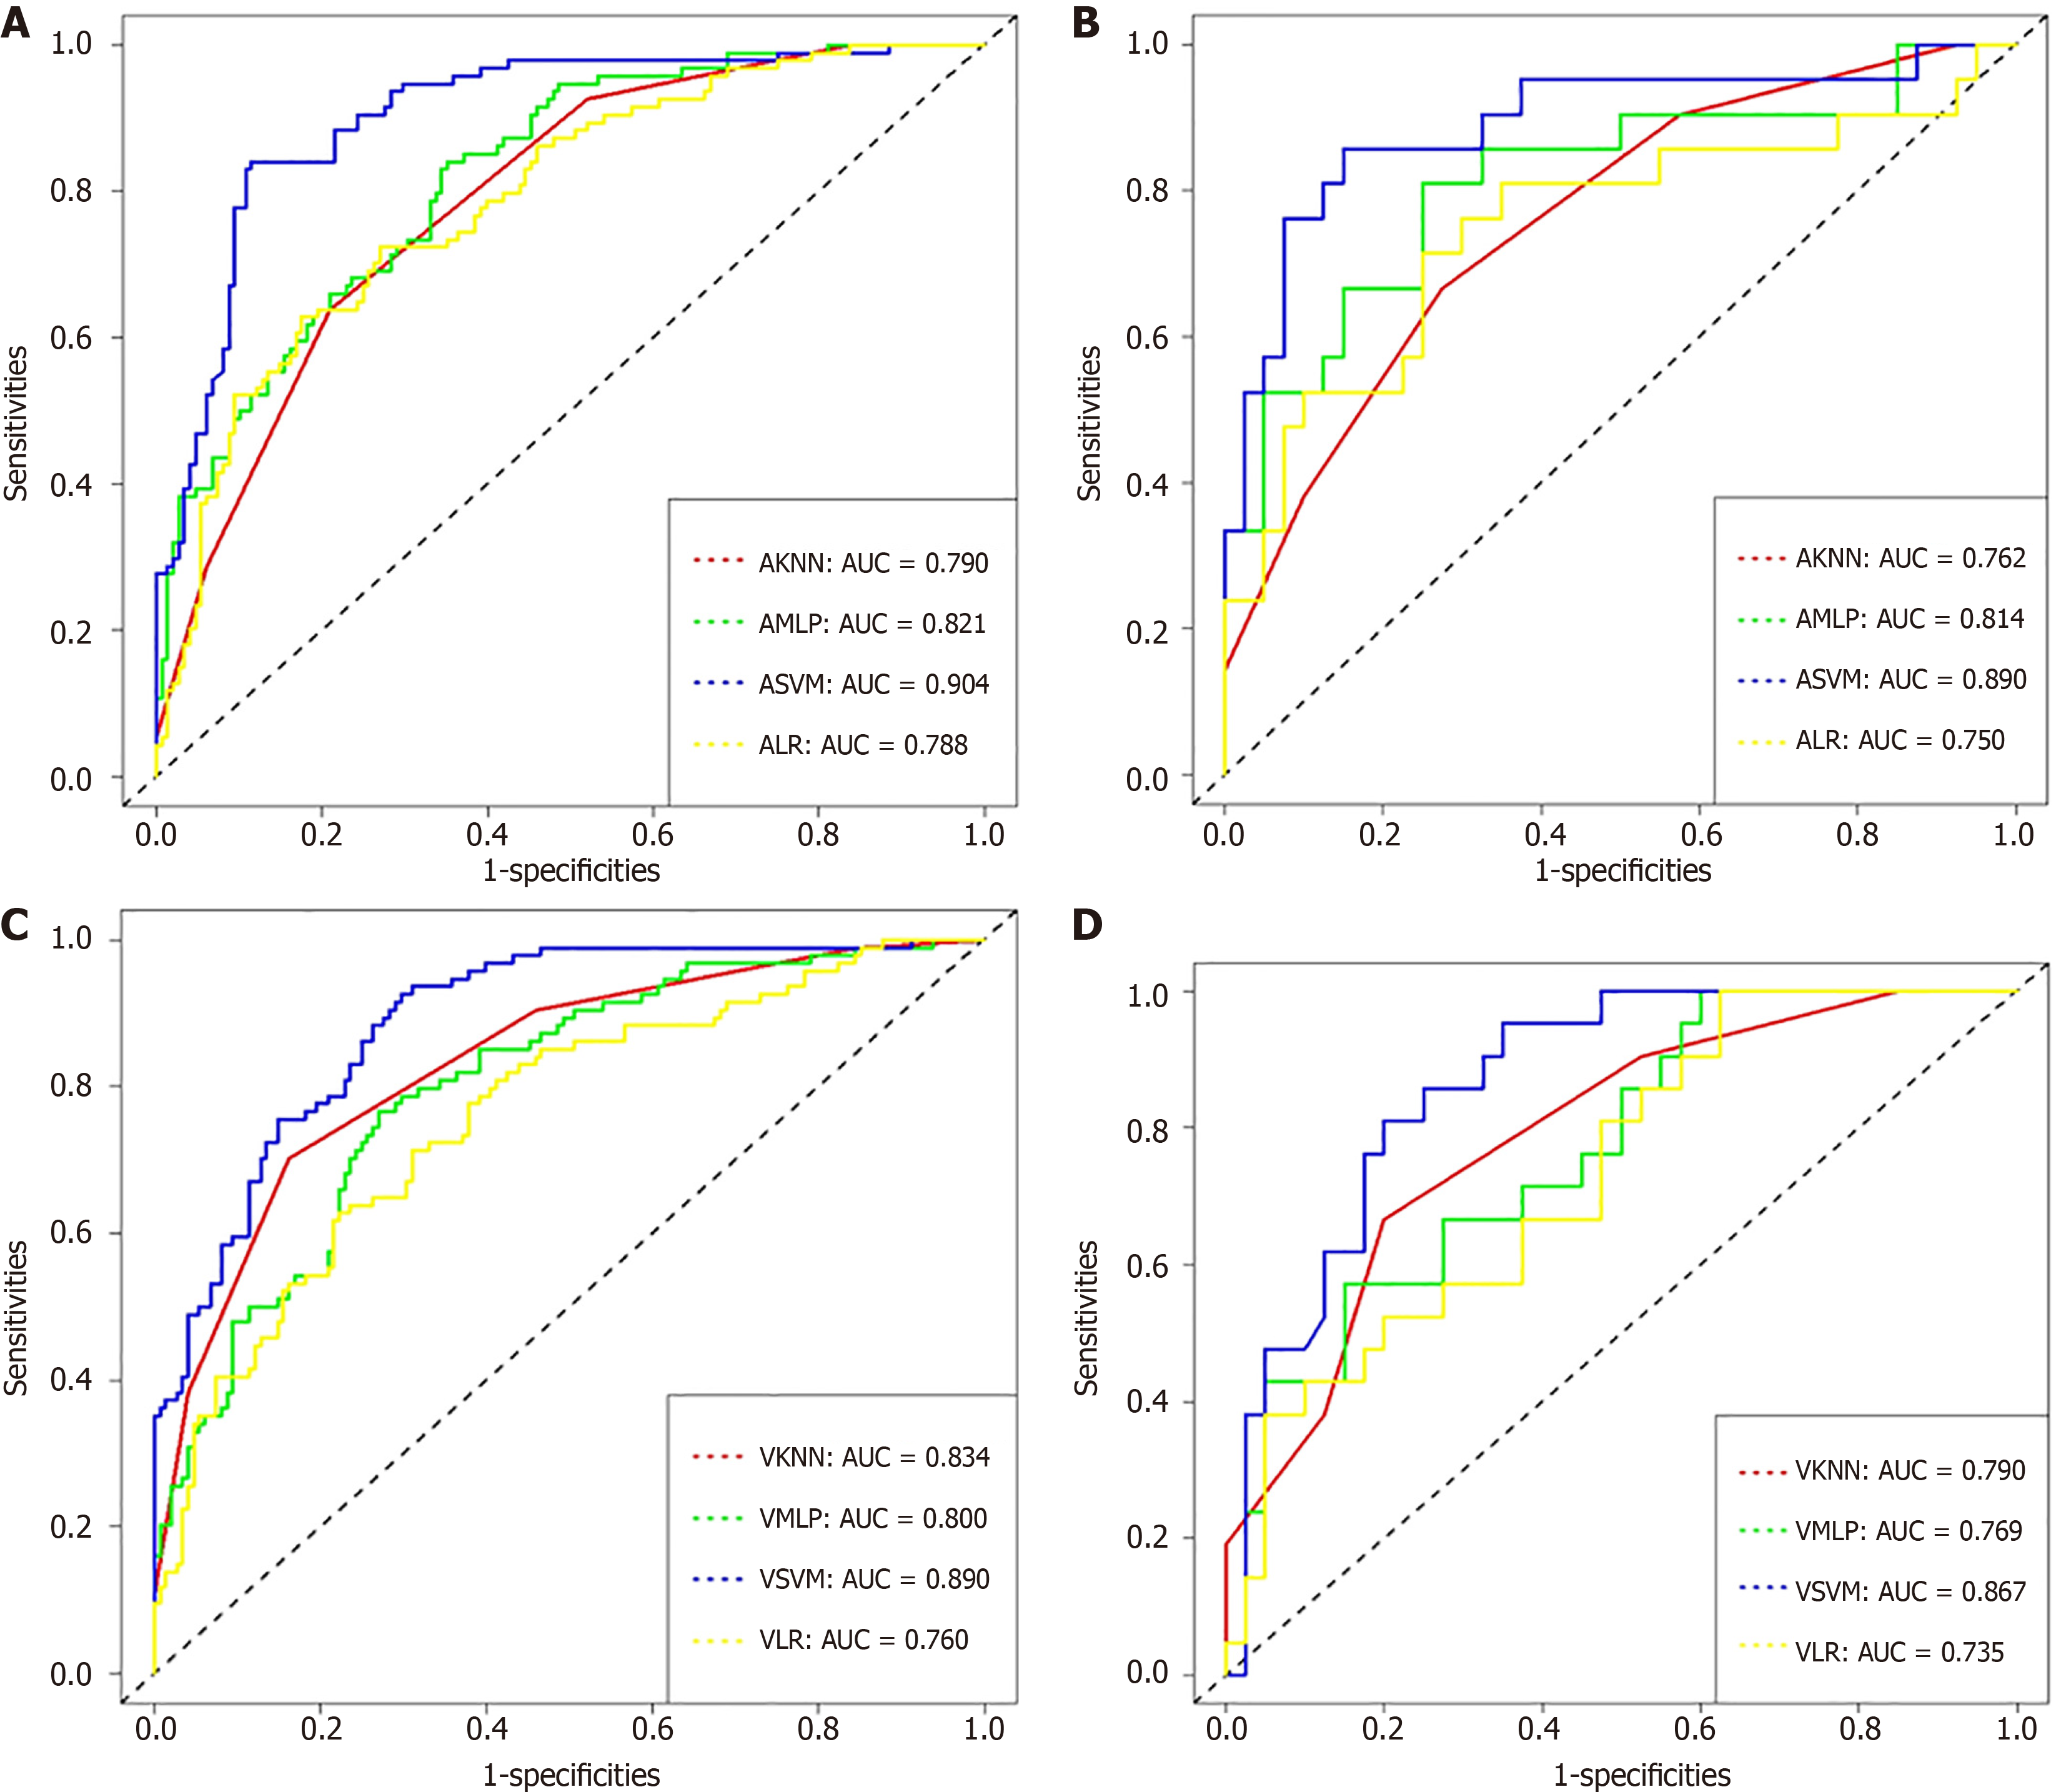
Figure 3 Receiver operating characteristic curves of the support vector machine, multi-layer perceptron, k-nearest neighbor and logistic regression.
A: Receiver operating characteristic (ROC) curves of arterial support vector machine (ASVM), arterial multilayer perceptron (AMLP), arterial k-nearest neighbor (AKNN) and arterial logistic regression (ALR) in the Training set; B: ROC curves of ASVM, AMLP, AKNN and ALR in the test set; C: ROC curves of VSVM, VMLP, VKNN and VLR in the Training set; D: ROC curves of VSVM, VMLP, VKNN and VLR in the test set.
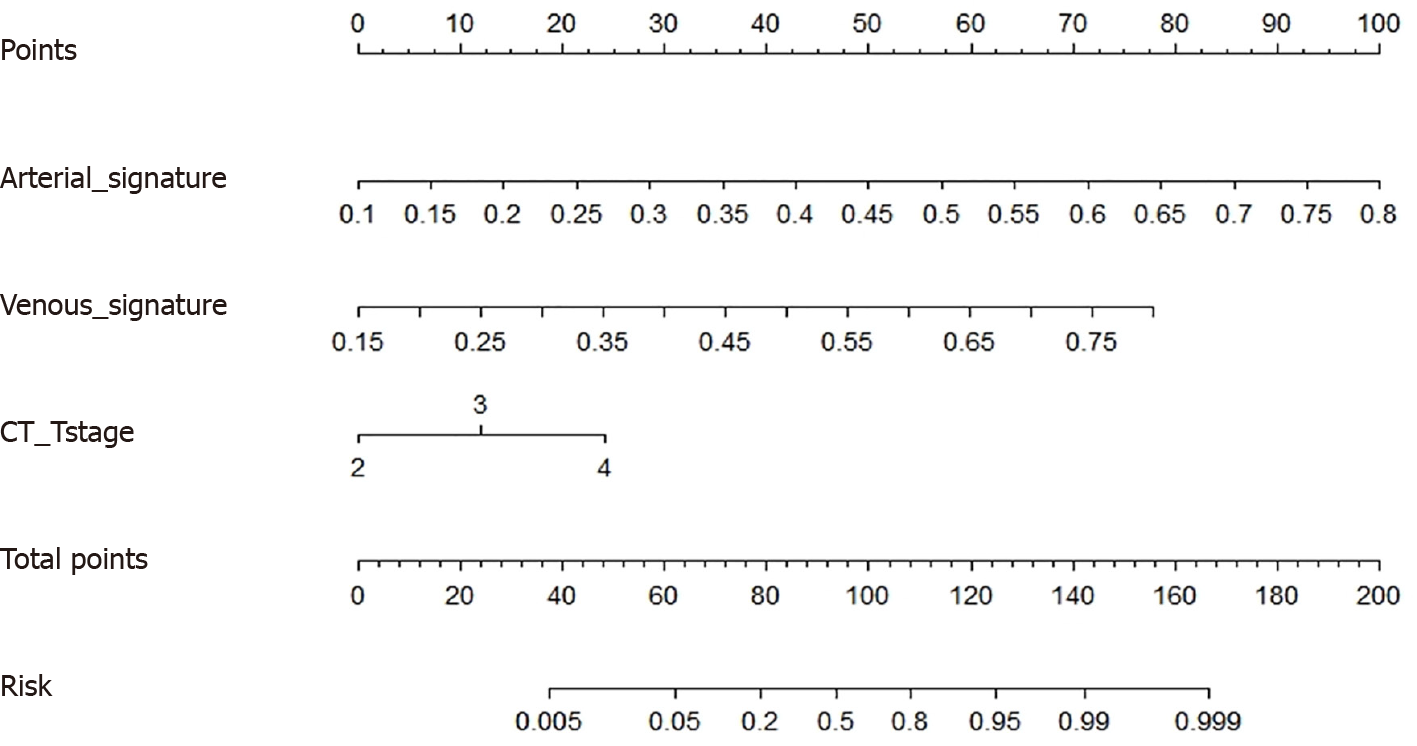
Figure 4 Nomogram based on the radiomics feature and clinical predictors.
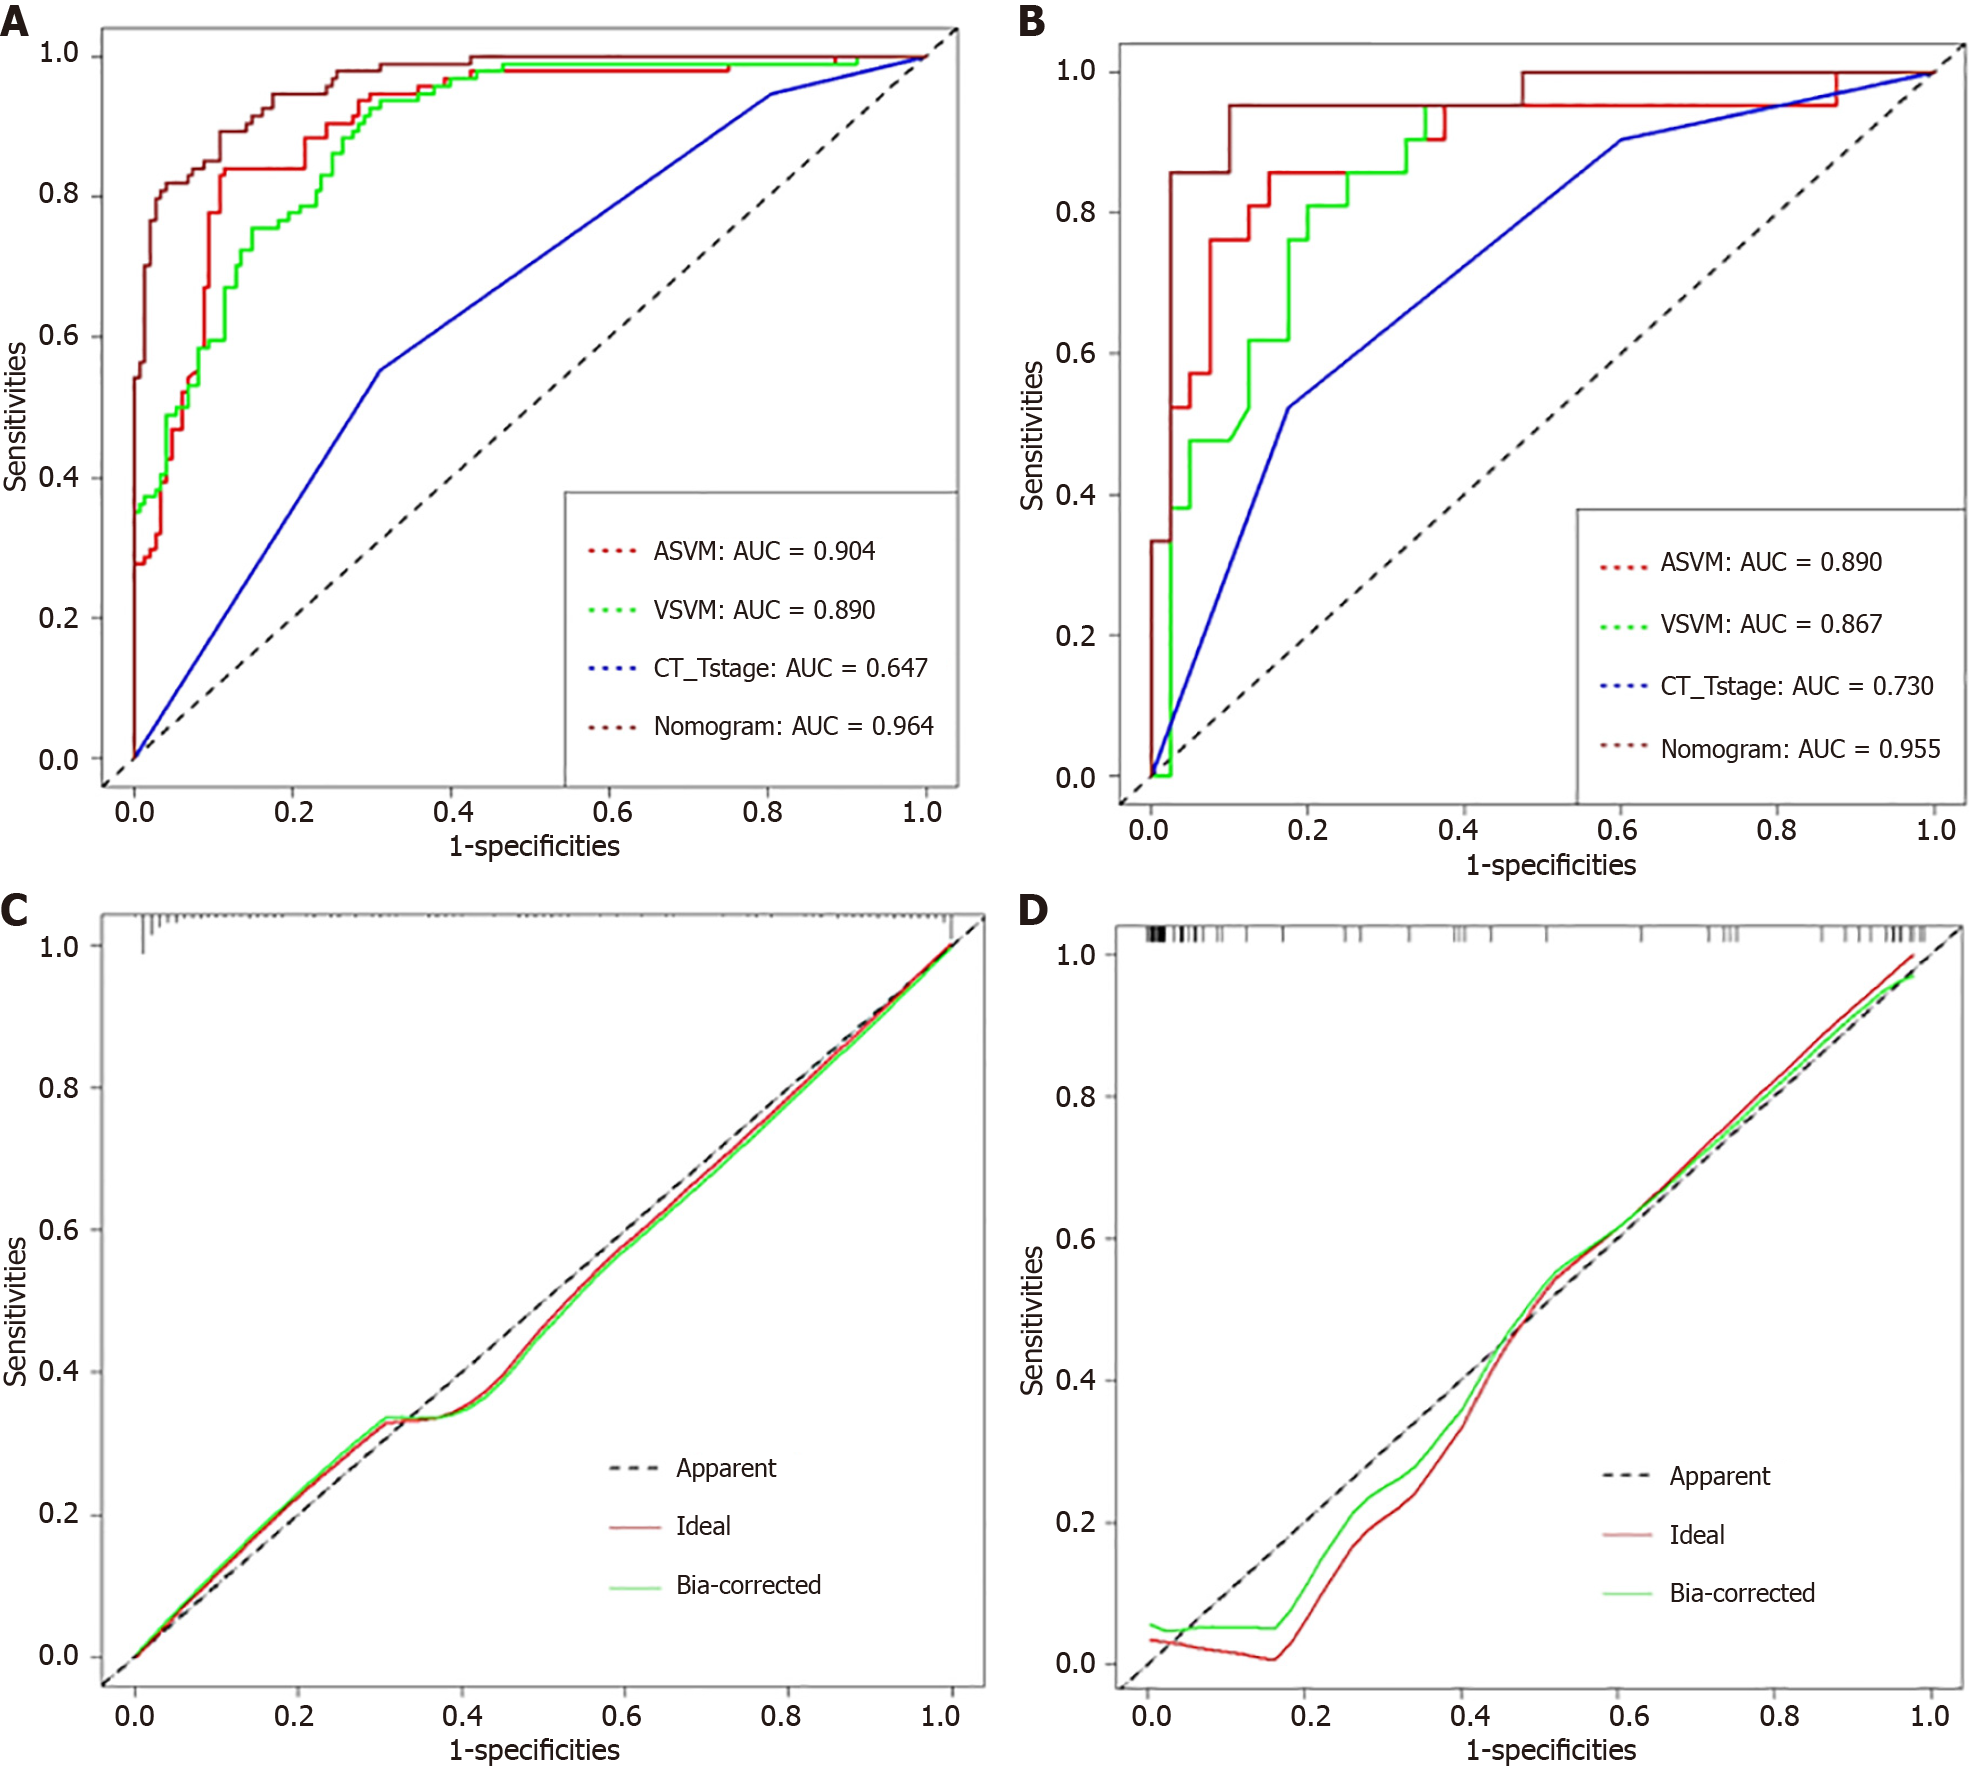
Figure 5 Receiver operating characteristic curves and calibration curves for training and test set.
A: Receiver operating characteristic (ROC) curves of CT_Tstage, arterial support vector machine (ASVM), enous support vector machine (VSVM) and stacking nomogram in the Training set; B: ROC curves of CT_Tstage, ASVM, VSVM and stacking nomogram in the Test set; C: Calibration curves of the stacking nomograms in the training set; D: Calibration curves of the stacking nomograms in the test set. X-axis represents the predicted risk of perineural invasion (PNI). Y-axis represents the actual PNI.
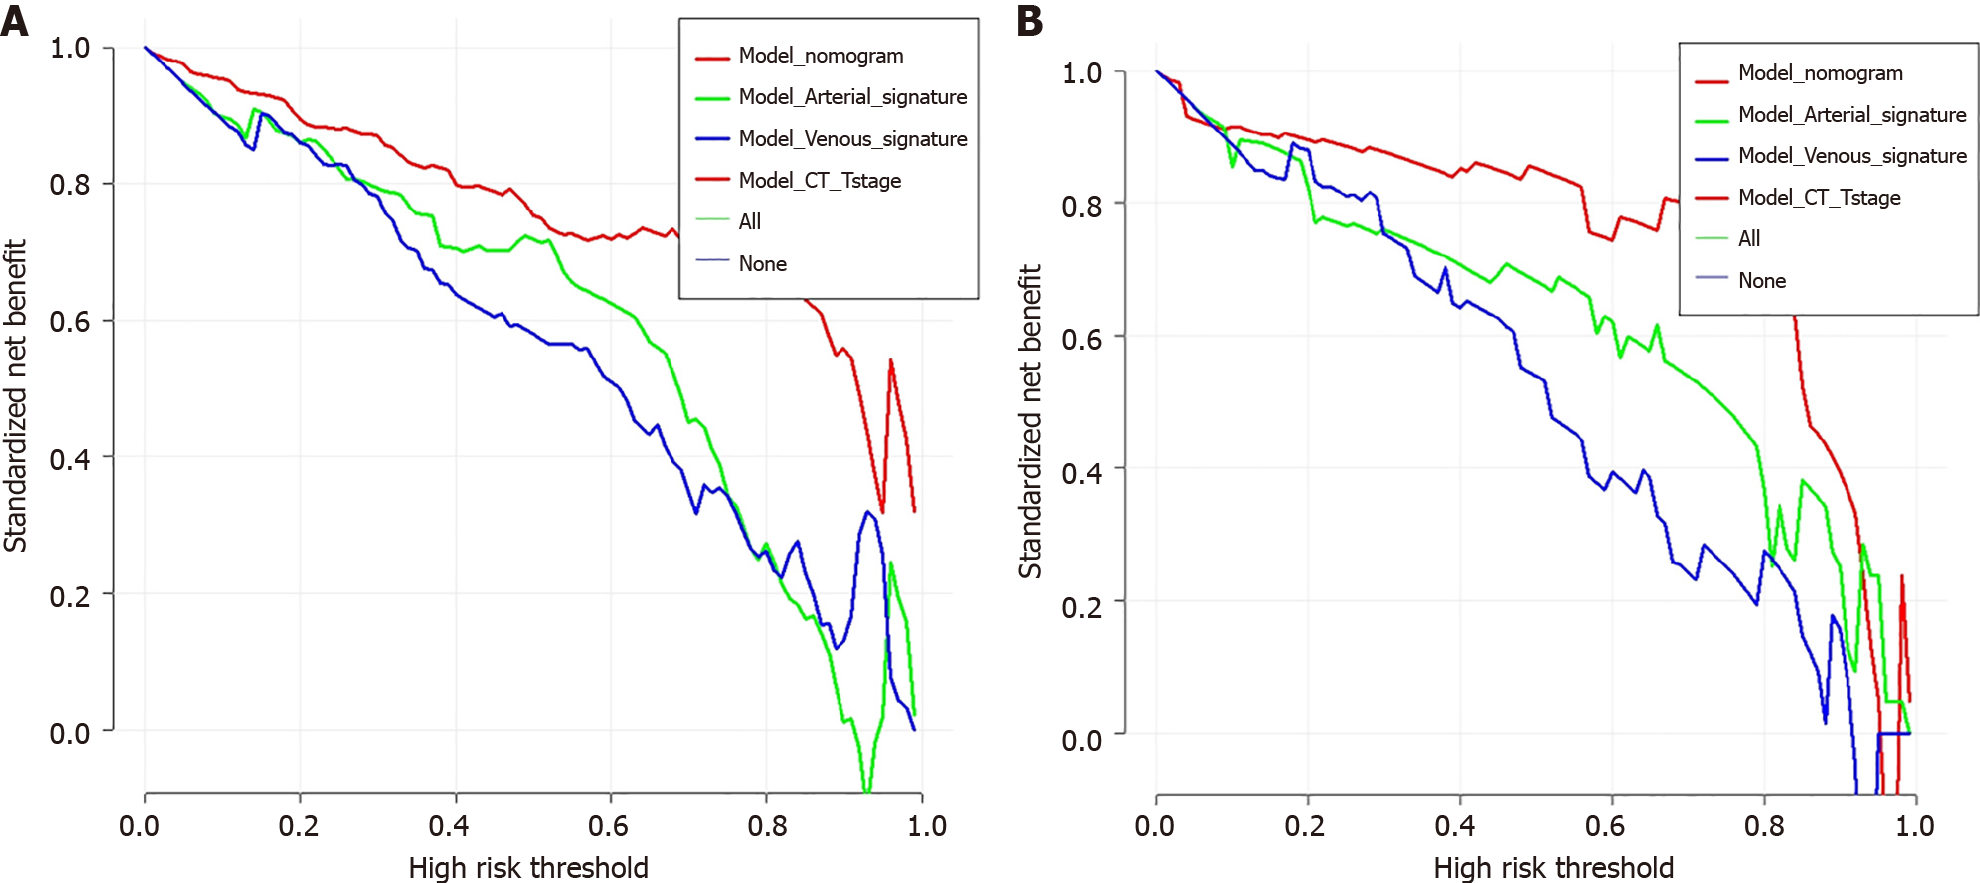
Figure 6 Decision curve analysis of four model.
A: Decision curve analysis of four model in the training set; B: Decision curve analysis of four model in the test set.
- Citation: Zhao ZC, Liu JX, Sun LL. Preoperative perineural invasion in rectal cancer based on deep learning radiomics stacking nomogram: A retrospective study. Artif Intell Med Imaging 2024; 5(1): 93993
- URL: https://www.wjgnet.com/2644-3260/full/v5/i1/93993.htm
- DOI: https://dx.doi.org/10.35711/aimi.v5.i1.93993


