


Published online Apr 28, 2022. doi: 10.35713/aic.v3.i2.27
Peer-review started: December 9, 2021
First decision: January 26, 2022
Revised: February 16, 2022
Accepted: April 28, 2022
Article in press: April 28, 2022
Published online: April 28, 2022
Processing time: 139 Days and 21.8 Hours
In their everyday life, clinicians face an overabundance of biological indicators potentially helpful during a disease therapy. In this context, to be able to reliably identify a reduced number of those markers showing the ability of optimising the classification of treatment outcomes becomes a factor of vital importance to medical prognosis. In this work, we focus our interest in inflammatory bowel disease (IBD), a long-life threaten with a continuous increasing prevalence worldwide. In particular, IBD can be described as a set of autoimmune conditions affecting the gastrointestinal tract whose two main types are Crohn’s disease and ulcerative colitis.
To identify the minimal signature of microRNA (miRNA) associated with colorectal cancer (CRC) in patients with one chronic IBD.
We provide a framework of well-established statistical and computational learning methods wisely adapted to reconstructing a CRC network leveraged to stratify these patients.
Our strategy resulted in an adjusted signature of 5 miRNAs out of approximately 2600 in Crohn’s Disease (resp. 8 in Ulcerative Colitis) with a percentage of success in patient classification of 82% (resp. 81%).
Importantly, these two signatures optimally balance the proportion between the number of significant miRNAs and their percentage of success in patients’ stratification.
Core Tip: This study provides an optimised strategy based on classic learning methods and multi-group variable selection combination from 2600 microRNAs of 225 patients with one chronic inflammatory bowel disease to identify the minimal signature of microRNAs associated with the development of colorectal cancer in these patients.
- Citation: Abaach M, Morilla I. Learning models for colorectal cancer signature reconstruction and classification in patients with chronic inflammatory bowel disease. Artif Intell Cancer 2022; 3(2): 27-41
- URL: https://www.wjgnet.com/2644-3228/full/v3/i2/27.htm
- DOI: https://dx.doi.org/10.35713/aic.v3.i2.27
The emergence of high-through experiments, image-based analysis and massive sequencing techniques[1-3] has disrupted the way clinicians make decision on a disease therapy. Now the usage of the grade of expertise in their respective do- mains to decide a treatment, frequently considered as a subjective evaluation, is strengthened by an overwhelming capability of support. However, this overabundance of available information does not make their task that straightforward. In this context, the use of interpretable mathematical methods can decipher the underlying complexity of data, generating systemic hypothesis that really help practitioners with their treatment outcomes. In this study, we introduce a learning framework based on a combination between unsupervised hierarchical clustering and weakly supervised classification approaches. These methods are applied to the analysis of a pool with approximately 6000 miRNAs extracted from biopsies of 216 inflammatory bowel disease (IBD) patients with and without colorectal cancer (CRC).
IBD consist of various disorders that cause prolonged inflammation of the digestive tract. Its prevalence rises more and more in the western developed countries[4] largely affecting their health-care systems. Besides that fact, the treatment of such disorders requires an early assessment of the response to the medical treatment[5]. Thus, the finding of a reduced signature optimally predicting the strata a patient will be lying on is of paramount importance during therapy. The main goal of our methodology is using the above approaches to reconstructing a minimal network that stratifies patients with a chronic IBD[5,6] having developed CRC as indicated in[7,8].
Unsupervised hierarchical clustering[5] is a robust method successfully used in the comparison of more than two groups. Particularly, this method enables the identification of biologically meaningful biomarkers, i.e. miRNAs, reducing significantly the amount of data in the study. Powered by parse partial least squares discriminant analysis (sPLS-DA) this signature becomes minimal[9] in the description of the required CRC network in IBD. And the later application of random forests (RF)[10] and support vector machines (SVM)[11,12] to the adjusted signature of selected miRNAs ensures the classification of patients is less sensitive to data heterogeneity. Regarding the calibration of classifiers, the performance of each algorithm is assessed by means of leave-one-out (LOO) cross validation[13] and their confusion matrices[14]. Overall this methodology shortens clinicians’ efforts, enhancing a reduced set of important features and avoiding unnecessary time delays prior to make any decision on the course of a disease therapy.
There exist intra patient differences in miRNA expression between the inflammatory and healthy tissue, between the healthy tissue of an inflammatory and non-inflammatory patient and between the healthy tissue of a cancer and non- cancer colic patient. We want to identify a minimal miRNA profile of developing or not cancer in patients with a chronic inflammatory bowel disease. In other words, a miRNA profile of healthy tissue from patients with chronic IBD with (case) vs without cancer (control). In that way, provided a specific miRNA profile is of interest, this one could be prospectively validated, and its predictive marker maybe also developed. Ultimately, this would allow clinicians to in- crease the diagnosis colonoscopy pace in IBD patients where a miRNA profile of risk is detected and conversely decreasing that pace in patients tagged as at lower risk.
Patients were recruited from various public French hospitals for this study. Our sample consists of 225 IBD patients with 75 cases developing dysplasia in colon. These cases matched with 150 controls, i.e., patients with IBD who did not develop dysplasia, yielding a total ratio of 1 case for each 2 controls. The extraction of 6609 miRNAs in each sample resulted from the biopsies of 216 quantified patients. A posteriori, 10 out of these 216 patients were discarded because of their difficulty in extracting miRNAS.
At least 40 biopsies were extracted from each sample during diagnostic chromo-endoscopies in IBD. The anatomopathological grading of inflammation described in[15,16] is adopted on the Hematoxylin Eosin Saffron slide of each sample. To not get affected the miRNA signature by a mucosa inflammation, only the healthy mucosa (non-inflammatory nor dysplastic) corresponding to the grade 0 in GOMES classification was collected. Finally, the absence of histological inflammatory lesion in the mucosa has been considered in preference to the colic segments.
Following the Affymetrix hybridisation standards[17], the intensity of miRNA was log2-transformed (Supplementary Figure 1). A first quality control on all miRNA was performed using a principal component analysis (PCA). PCA by[18] allows transforming a set of correlated data, herein their intensity in the gene-chip of Affimetrix GeneChip miRNA 4.0 chips, in a new data set, uncorrelated, by following the top ranked principal components. These components are used as axes of a new space where detect patients with an ambiguous score of intensity, i.e., those intensity outputs generated by unsuitable experimental condition, and exclude them all. Just after one of the two RNA strands becomes functional the miRNA is prepared to participate in intricate biological processes within the cell. This maturation process leads the miRNA to a “steady-state” that provides a more valuable biological information. Thus, we opted for considering only mature transcript miRNAs defined in[19], noted by MIMAT, in the completion of this study. Those transcripts amount to 2578 miRNAs in total. In addition, miRNAs with an average intensity > 8 were also removed being considered as outliers of the overall expression profile.
The Affymetrix Genechip 4.0 encompasses around 36000 probes, more than 6000 of which are humans (each probe corresponds to a complementary sequence of nucleotides). Details on each miRNA and sample are provided by the Affymetrix database. The intensity values of 6609 miRNAs are considered from the 216 patients. Notably, both the RNA extraction and the miRNA technical analysis were performed twice with similar library sizes (see Supplemental Material) detecting a very low bias attributable to a defective sample collection or a poor miRNA quality.
Differential expression using general linear models: A first signature of differentially expressed (DE) miRNAs is inferred from general linear models implemented in the limma R-package[20]. During this process we estimate variance for other miRNAs, weight to incorporate unequal variations in data, and pre-process to reduce noise.
Multiclass DE analysis: The signature identified by linear models returned an amount of miRNAs larger than expected to be considered in practice as biologically significant. We decided, then, to reduce the size of miRNA signature by means of a multi-group comparison strategy. Firstly, we cal- culated the mean expression of each miRNA according to the four analysed groups [i.e., Ulcerative colitis (UC) and Crohn’s disease (CD) cases and controls respectively]. Next, we construct the tree related groups. Thus, we assume an underlying tree structure to compare groups based on recursive binary splits along the tree. Then each mean expression was compared, using a simple t test as in[21]. Any miRNA with a significant t test (i.e., threshold = 0.005) was included in the final model.
We propose different strategies to test in pairwise all the possible combinations of groups: (1) Use the CD patients or the UC patients exclusively; and (2) Use each one of the groups to construct the tree (Figure 1 and Table 1): (1) Strategy 1: Comparison between the CD controls and the three remaining leaves (UC controls, CD cases and UC cases), then UC controls compare to CD cases and UC cases, etc.; (2) Strategy 2: Comparison between each leaf and the others; CD controls compare to UC controls, CD cases and UC cases, then UC controls compare to CD controls and cases, and UC cases, and so on; and (3) Strategy 3: Comparison among leaves one by one; CD controls compare to UC controls, then CD controls compare to CD cases, and so on.

| Strategy | Comparison |
| Strategy 1 (classic) | 1 vs (2,3,4) |
| 2 vs (3,4) | |
| 3 vs 4 | |
| Strategy 2 (1&1) | 1 vs 2; 1 vs 3; 1 vs 4 |
| 2 vs 1; 2 vs 3; 2 vs 4 | |
| 3 vs 1; 3 vs 2; 3 vs 4 | |
| 4 vs 1; 4 vs 2; 4 vs 3 | |
| Strategy 3 (pairwise) | 1 vs (2,3,4) |
| 2 vs (1,3,4) | |
| 3 vs (1,2,4) | |
| 4 vs (1,2,3) |
Upon setting the methodology, we analyse two related data set in tandem. Initially, we applied the method only to the miRNA labeled as MIMAT; to repeat the same approach, on a second occasion, with a set of 152 miRNAs previously selected by sparse PLS Discriminant Analysis (sPLS-DA).
In brief, PLS is an exploratory variable selection technique successfully proven in classification[22]. In particular, the sPLS-DA[9] is an extension of PLS applied in multi-class classification. It selects the most discriminant variables to classify patients, using Lasso penalization. By means of the mixOmics R package[23] three components of miRNAs were identified to predict cancer in all patients. The number of selected variables for each of the three components was chosen based on the lowest average balanced classification error rate with centroids after tuning of the sPLS-DA model using the selected number of components and 5-fold cross-validation with 10 repeats. The linear programming problem associated with sPLS-DA may be succinctly described as:
Where 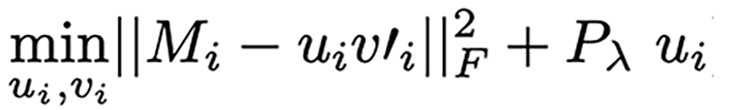 , is applied component-wise in the vector
  (i.e., the left singular vector from the Singular Value Decom-position (SVD) of the miRNA matrix expression M) and acts as the relaxed thresholding function that scales the Lasso penalty functions[24]. Thus, λ is the penalization parameter to tune.
Each sPLS-DA axe is constructed by a convex linear combination of a miRNA. Hence, the coordinate of any given patient on that axe is described by:
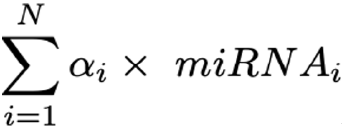
Then applying the majority vote criterion, any given individual having been calculated to have a probability > 0.5 in at least 2 out of 3 PLS-DA axes is considered misclassified.
In an early exploratory classification, we based our results on the Euclidian distance of miRNA intensities across patients. Nevertheless, the high sensitivity of the Euclidean-based norm to heterogenous data and non-linearity produced a poor classification (Supplementary Figure 2). Anyway, this first classification definitively clued us in on the miRNA signature’s optimisation. Next, to prevent the non-linear effect of our measurements in classification, we contemplated the employment of learning methods. Thus, the main purpose random forests and support vector machines pursue is the re-construction of a minimal CRC network that could lead to optimally stratify the IBD patients evaluating the associated miRNA signature. These two methods are powerful tools to predict patients developing CRC that perform well in different classification issues. Briefly, RF is a machine learning method for classification based on decision tree and probabilities, introduced in[10], whereas SVM is a strong classifier with the aim of finding the optimal separation hyperplane of data by maximising the margin[25]. A total of 5,000 trees were conducted for RF analysis. The SVM was implemented using a linear kernel, i.e., 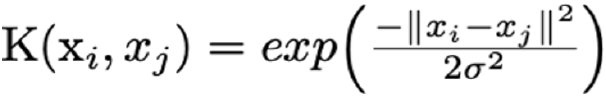 with bandwidth and including soft-regularisation with Sequential Minimal Optimization (SMO) as solver to find the optimal hyperplane well separating classes. The general out- put of a binary SVM classifier can be computed by the following expression:
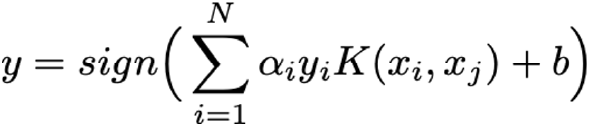
where
We evaluate how optimal a miRNA signature is by means of its confusion matrix, using the confusionMatrix function of the caret R-package[28], and the so-called Receiver Operating Characteristic (ROC) curve along the calculus of its area under curve (AUC) using the plotROC R-package[29]. Percentage of true classification, sensibility, specificity, and the AUC were also calculated for each strategy using these two packages.
In summary, all the calculations of the statistical learning analysis were implemented using in-house scripts based on R and Matlab© (2014a, The MathWorks Inc., Natick, MA), and figures were depicted with ggplot2 R-package.
A previous work of denoising is required if we want to reduce possible issues of bias and overfitting in our algorithms. Thus, the analysis was performed on 206 patients; excluding 4 patients considered as outliers, and 6 unmatched controls with cases. In addition, 101 miRNAs were removed since their expression was higher than 8. These miRNAs highly influenced to broke inconsistently down large clusters in the construction of tree and though considered as outliers. Yet, note that the unsupervised clustering can be biased by the lack of linearity in data. Hence, the way we use the hierarchical classification is limited to track a definite signature trend to be further learned by more robust methods. The best result was always obtained by the strategy 1. For clarity, we only show those results yielded by means of this strategy. We address to supplemental material for further details on the other two remaining strategies (Supplementary Figures 3-5 and 7-8). Naturally, the performance of this approach depends on each initial tree re- construction. The Table 2 summaries patients classification performed by all the methods using the strategy 1.
| Methods | Nº miRNA | % True classification (95%CI) | Sensitivity | Specificity | AUC |
| All miRNA | |||||
| Strategy 1 | 56 | 69 (62-75)/69 (62-75) | 0.25/0.43 | 0.93/0.83 | 0.76/0.74 |
| CD | 9 | 87 (78-93)/86 (77-92) | 0.70/0.73 | 0.96/0.93 | 0.89/0.92 |
| UC | 30 | 72% (63-80)/76 (67-83) | 0.45/0.55 | 0.86/0.87 | 0.77/0.81 |
| miRNAs selected by sPLS-DA | |||||
| Strategy 1 | 11 | 69 (62-75)/68 (62-75) | 0.36/0.36 | 0.87/0.86 | 0.72/0.74 |
| CD | 5 | 80 (70-88)/82 (67-86) | 0.67/0.60 | 0.87/0.87 | 0.84/0.86 |
| UC | 8 | 73 (64-80)/81 (73-88) | 0.48/0.57 | 0.86/0.93 | 0.73/0.81 |
A priori, one would expect to find here a tree with two well separated branches making distinction between CD and UC patients. Nevertheless, the tree this first comparison returned describes a structure composed of three branches that mixes up cases with controls. Hence, the primary leaf groups the CD cases, the second one binds UC cases together, whereas the third leaf consists of control patients. See Supplementary Figure 1 to visualise the tree corresponding to the analysis of all the IBD patients.
Strategy 1: When this first strategy is considered, we are able to identify 56 miRNAs whose expression is differential between the CRC cases and controls. Those miRNAs are potentially good candidates to be associated with a CRC network that can achieve an optimal stratification of patients. A heatmap enhancing these miRNAs are depicted below in Figure 2. However, data heterogeneity and non-linearity negatively influence the measures captured by our multi-class strategy producing a poor stratification performance when re- constructing the sought minimal CRC network. To overcome such an obstacle, we keep using the selected miRNAs, but applied to classifiers such as RF and SVM which are more robust in presence of non-linear heterogeneous data. This combination enables better learning how patients stratify according to CRC. In that way, we attained to correctly classify the 69% of patients by means of RF and using linear SVM (see Table 2 and Figure 2B and C). However, the SVM performance overtakes at large that one given by RF in every case of patient stratification. Notice the large number of selected miRNAs in this first analysis. For clarity, the VIMP analysis shown in Supplementary Figure 6A only discloses the top 30 miRNA. The results obtained in the performance of patients’ classification is represented as a confusion matrix in Table 3. In general control patients were correctly classified, but a remarkable number of cases was muddled with controls. This situation can be explained by the, pointed out in the literature, divergent genetic source of the two types of IBD. The ROC curve displayed in Figure 2B and C reported sensitivity-specificity ranges of 0.25-0.93 and 0.43-0.83 associated with RF and SVM respectively (Table 2).

| Predicted by RF Predicted by SVM | |||||
| Cases | Controls | Cases | Controls | ||
| True | Case | 18 | 54 | 31 | 41 |
| Controls | 10 | 124 | 23 | 111 | |
For this analysis we provide a sample data composed of 85 patients with CD, whose 30 are cases and 55 controls. As observed in panel (A) of Figure 3, we detect 9 miRNAs differentially expressed between cases and control in CD patients. But the use of the Euclidian distance misleads their percent- age of classification as occurred in the previous case-control study. The results obtained by the above indicated RF and SVM learning methods may be observed in Figure 3B and C and Table 2. The variable importance of each miRNA is also considered to simplify the calibration of the RF models (data not shown, see Supplementary Figure 6B). Moreover, their associated sensitivity-specificity ranges are 0.70-0.73 and 0.96-0.93 to RF and SVM respectively (Table 2). With these selected miRNAs, patients are correctly classified in the 87% and 86% of cases. These percentages are also shown in terms of a confusion matrix in Table 4. The adopted non supervised - supervised strategy returns rather good candidates to conform the network associate to CRC in IBD also providing the signature with an accurate predictive ability.

| Predicted by RF Predicted by SVM | |||||
| Cases | Controls | Cases | Controls | ||
| True | Case | 21 | 9 | 22 | 4 |
| Controls | 2 | 53 | 8 | 51 | |
To identify a significant signature of UC patients we analysed a data set of 121 individuals. These patients are distributed in 42 cases and 79 controls respectively. Upon applying the previous approach to these samples, a signature of 30 miRNAs differentially expressed between cases and control in UC was detected. The results derived from this calculation are plotted below in Figure 4.

As occurred with the two previous results, see Figure 2 and Figure 3, the presence of data heterogeneity hampers a right classification of patients when using the Euclidean norm across the expression profile of the detected 30 miRNAs. Additionally, the classification results yielded by the two learning methods used in this work are displayed by their ROC curves in Figure 4B and C. These curves attain a sensitivity-specificity ranges of 0.45-0.86 and 0.55-0.87 to RF and SVM respectively. And the miRNAs selected by multiple comparison of the annotated miRNAs achieved a percentage of success in classification of 76% across the mean expression of each group of patients. These amounts are slightly lower than in CD patients. Such a drop can be explained by a more scatter matching distribution among UC patients as well as a greater control-case ratio. The confusion matrix corresponding to this calculation is introduced above in Table 5.
| Predicted by RF Predicted by SVM | |||||
| Cases | Controls | Cases | Controls | ||
| True | Case | 19 | 23 | 23 | 19 |
| Controls | 11 | 68 | 10 | 69 | |
Despite the relative low size of the prognostic signature identified so far, we wonder if it was possible to minimise the amount of miRNAs involved in the analysis without harming the overall classification performance. The statistical robustness of the parse PLS Discriminant Analysis in supervised feature selection makes us to consider its application before performing the unsupervised hierarchical clustering introduced in methods. The stratification of all patients is plotted in Figure 5A while Figure 5B describes the diseases tree architecture. The synergy between the two complementary statistical methods, supervised later unsupervised, still allow us to conclude the predictive power of the miRNAs minimal signature associated with CRC in IBD.

Reconstructing the overall signature: After having applied the proposed sPLS-DA to the miRNAs, the reconstruction of the tree structure based on the multi-class comparison strategy 1 improved the previous classification of patients between clusters (Figure 5B). The analysis of patients following such architecture resulted in a final signature composed by 11 miRNAs. Hence, these selected miRNAs correctly classified the 69% and 68% of cases (RF and SVM respectively). Both percentages are similar in accuracy to those obtained without the use of sPLS-DA, but with a signature consisting of only 11 out of initial 56 miRNAs. Nevertheless, the effect of the genetic drift of CD and UC origin could not have been prevented. We also provide the overall performance of the methods as a confusion matrix in the Table 6. For further details on the variable importance of this signature in the RF calculation see supplemental information (Supplementary Figure 9A).
| Predicted by RF Predicted by SVM | |||||
| Cases | Controls | Cases | Controls | ||
| True | Case | 27 | 45 | 26 | 46 |
| Controls | 18 | 116 | 19 | 115 | |
Reconstructing the local signature of the CD patients: In this analysis 5 miRNAs were selected with the recursion cluster for CD patients. The SVM allows a better classification of true patients in the 82% of cases, and particularly the controls patients. The RF and SVM performances along their feature selection refining are presented in Figure 6B. See supplemental material for details on variable importance for each miRNA (Supplementary Figure 9B) of the RF computation. We also obtain their patients classification in a confusion matrix presented in Table 7. The accuracy and sensitivity are consistent with the above percentage of classification in CD patients reducing the signature in 4 miRNAs up to a final figure of 5 predictive profiles.

| Predicted by RF Predicted by SVM | |||||
| Cases | Controls | Cases | Controls | ||
| True | Case | 20 | 10 | 20 | 10 |
| Controls | 7 | 48 | 5 | 50 | |
Reconstructing the local signature of UC patients: The overall signature of UC patients after making use of sPLS-DA was composed of 8 miRNAs. We also calibrated models by feature selection of these miRNAs, which results are shown in the Figure 6C. The attained percentage of success goes to the 81% upon computation of a SVM model across UC samples what improved the RF performance as had already occurred with previous counterpart calculations. For further details on the RF analysis see Supplementary Figure 9C. Strikingly the use of sPLS-DA enabled reducing the quantity of miRNAs required to predict UC patients developing or not CRC from 30 to 8 while increasing in a 5% the percentage of success. This may be due to the detection and later removal of features largely contributing to the dispersal form of the matching distribution among UC patients. Finally, the confusion matrix corresponding to this miRNAs signature is described below in Table 8.
| Predicted by RF Predicted by SVM | |||||
| Cases | Controls | Cases | Controls | ||
| True | Case | 20 | 22 | 24 | 18 |
| Controls | 11 | 68 | 5 | 74 | |
The soundness of the signature has been improved accordingly to the incremental combination of learning methods presented in this study until attaint a sensitivity of 73% in CD and 57% in UC with a specificity of 87% and 93% in CD and UC respectively (see Table 2). These results are depending on the assumption of an initial hierarchical tree structure. The usage of PLS-DA decreases a bit its global sensitivity but gaining more in CRC signature optimisation. Noteworthy, the final overall signature is composed by only 5 miRNAs in CD and 8 in UC. These miRNAs are molecules extremely resistant and highly preserved. In general, low percentages of true classification are obtained is no difference on disease type is made on the IBD patients. This is in accordance with previous works that suggest the genetic divergence between CD and UC. However, if we consider the two types of the disease separately, the aim of classifying false controls, i.e., controls with a closer profile to cases and monitoring whether those samples are developing cancer can be approached now. Indeed, the introduced methodology would allow us to provide the identified molecular signature with predictive power. Additionally, the eventual availability of a second independent cohort could improve possibly the precision of results. Thus, we claim that in any case a clinician having this information will potentially benefit from an accurate prediction tool of prognosis rather than only using his or her own experience-based criteria[30,31]. This clinical scenario enhances the paramount importance of statistical learning-based applications in clinical practice since CRC is a feared life-threatening factor among patients with IBD[32,33]. In particular, the analysis of eventual miRNAs signatures associated with CRC in patients with IBD has been successfully proven previously in such contexts[34-36]. That way, these methodologies will contribute to shorten unnecessary delays prior to make any decision on a proper therapy in individuals with a IBD developing CRC[37,38].
In this study we provide a wise combination of statistical learning methods for patients’ stratification based on biologically meaningful characteristics, and its application in IBD based on a minimal miRNA network associated with CRC is demonstrated. The time constraint affecting the assessment of the response to the medical treatment indicates the interest of our method in improving the classification accuracy, minimising the signature of miRNAs required in the IBD patients’ stratification, and avoiding unnecessary time delays. The findings are also consistent with the physio-pathological knowledge. Comparison with other existing classifying method shows that SVM makes our method yields better mean performances, using a reduced miRNA signature and reporting a much lower sensitivity to data heterogeneity. The application of the proposed method to a multi-class classification further points out the robustness and efficiency of our strategy particularly in the CD and UC group of patients. Additionally, the use of parse PLS Discriminant Analysis is also concluded for a minimal signature with accurate enough performances. In the next future, we will combine this method with other approaches such as deep learning methods enabling more intricate relationships between the elements of the signature and possibly another robust clinical data. Finally, we are convinced our methodology will be also instrumental for other diseases broadening the general framework herein provided.
Face the overabundance of information, it is not easy to clinicians discriminating amid biological indicators that potentially could be helpful during an inflammatory bowel disease (IBD) disease therapy.
There exist intra patient differences in miRNA expression between the inflammatory and healthy tissue, between the healthy tissue of an inflammatory and non-inflammatory patient and between the healthy tissue of a cancer and non- cancer colic patient. We want to identify a minimal miRNA profile of developing or not cancer in patients with a chronic inflammatory bowel disease. In other words, a miRNA profile of healthy tissue from patients with chronic IBD with (case) vs without cancer (control). In that way, provided a specific miRNA profile is of interest, this one could be prospectively validated, and its predictive marker maybe also developed. Ultimately, this would allow clinicians to in- crease the diagnosis colonoscopy pace in IBD patients where a miRNA profile of risk is detected and conversely decreasing that pace in patients tagged as at lower risk.
In this scenario, the identification of an optimal signa- ture, for example composed by microRNA (miRNA), associated with colorectal cancer (CRC) in patients with one chronic IBD is of vital importance.
We provide a framework of well-established statistical learning methods (i.e., RF, SVM, PLS-DA, ...) wisely adapted to reconstructing a CRC network leveraged to stratify these patients.
Our strategy provides an adjusted signature of 5 miRNAs with a percentage of success in patient classification of 82% in Crohn’s disease (resp. 81% in Ulcerative Colitis).
The application of the proposed method to a multi-class classification further points out the robustness and efficiency of our strategy particularly in the CD and UC group of patients. Additionally, the use of parse PLS Discriminant Analysis spots a minimal signature with accurate enough performances.
In the next future, the combination of this method with deep learning models will enable more intricate relationships between the elements of the signature and possibly another robust clinical data. Finally, we are convinced our methodology will be also instrumental for other diseases broadening the general framework herein provided.
Provenance and peer review: Invited article; Externally peer reviewed.
Peer-review model: Single blind
Corresponding Author's Membership in Professional Societies: Université Sorbonne Paris Nord.
Specialty type: Mathematical and computational biology
Country/Territory of origin: France
Peer-review report’s scientific quality classification
Grade A (Excellent): A
Grade B (Very good): B
Grade C (Good): 0
Grade D (Fair): 0
Grade E (Poor): 0
P-Reviewer: Bertani L, Italy; Sassaki LY, Brazil S-Editor: Liu JH L-Editor: A P-Editor: Liu JH
| 1. | Goodwin S, McPherson JD, McCombie WR. Coming of age: ten years of next-generation sequencing technologies. Nat Rev Genet. 2016;17:333-351. [RCA] [PubMed] [DOI] [Full Text] [Cited by in Crossref: 2404] [Cited by in RCA: 2431] [Article Influence: 303.9] [Reference Citation Analysis (0)] |
| 2. | Morilla I, Lees JG, Reid AJ, Orengo C, Ranea JA. Assessment of protein domain fusions in human protein interaction networks prediction: application to the human kinetochore model. N Biotechnol. 2010;27:755-765. [RCA] [PubMed] [DOI] [Full Text] [Cited by in Crossref: 6] [Cited by in RCA: 6] [Article Influence: 0.4] [Reference Citation Analysis (0)] |
| 3. | Morilla I, Doblas S, Garteiser P, Zappa M, Ogier-Denis E. Scores of intestinal fibrosis from wavelet-based magnetic resonance imaging models. Rojas I, Ortuño F, editors. Bioinformatics and Biomedical Engineering (Springer International Publishing), 2017: 569-578. [DOI] [Full Text] |
| 4. | Ng SC, Shi HY, Hamidi N, Underwood FE, Tang W, Benchimol EI, Panaccione R, Ghosh S, Wu JCY, Chan FKL, Sung JJY, Kaplan GG. Worldwide incidence and prevalence of inflammatory bowel disease in the 21st century: a systematic review of population-based studies. Lancet. 2017;390:2769-2778. [RCA] [PubMed] [DOI] [Full Text] [Cited by in Crossref: 2677] [Cited by in RCA: 4102] [Article Influence: 512.8] [Reference Citation Analysis (110)] |
| 5. | Morilla I, Uzzan M, Laharie D, Cazals-Hatem D, Denost Q, Daniel F, Belleannee G, Bouhnik Y, Wainrib G, Panis Y, Ogier-Denis E, Treton X. Colonic MicroRNA Profiles, Identified by a Deep Learning Algorithm, That Predict Responses to Therapy of Patients With Acute Severe Ulcerative Colitis. Clin Gastroenterol Hepatol. 2019;17:905-913. [RCA] [PubMed] [DOI] [Full Text] [Cited by in RCA: 1] [Reference Citation Analysis (0)] |
| 6. | Sedghi S, Barreau F, Morilla I, Montcuquet N, Cazals-Hatem D, Pedruzzi E, Rannou E, Tréton X, Hugot JP, Ogier-Denis E, Daniel F. Increased Proliferation of the Ileal Epithelium as a Remote Effect of Ulcerative Colitis. Inflamm Bowel Dis. 2016;22:2369-2381. [RCA] [PubMed] [DOI] [Full Text] [Cited by in Crossref: 10] [Cited by in RCA: 9] [Article Influence: 1.0] [Reference Citation Analysis (0)] |
| 7. | Kim ER, Chang DK. Colorectal cancer in inflammatory bowel disease: the risk, pathogenesis, prevention and diagnosis. World J Gastroenterol. 2014;20:9872-9881. [RCA] [PubMed] [DOI] [Full Text] [Full Text (PDF)] [Cited by in CrossRef: 274] [Cited by in RCA: 300] [Article Influence: 27.3] [Reference Citation Analysis (1)] |
| 8. | Mattar MC, Lough D, Pishvaian MJ, Charabaty A. Current management of inflammatory bowel disease and colorectal cancer. Gastrointest Cancer Res. 2011;4:53-61. [RCA] [PubMed] [DOI] [Full Text] [Cited by in Crossref: 1] [Cited by in RCA: 1] [Article Influence: 0.1] [Reference Citation Analysis (0)] |
| 9. | Wang Y, LêCao KA. Managing batch effects in microbiome data. Brief Bioinform. 2020;21:1954-1970. [RCA] [PubMed] [DOI] [Full Text] [Cited by in Crossref: 35] [Cited by in RCA: 74] [Article Influence: 12.3] [Reference Citation Analysis (0)] |
| 10. | Breiman L. Random forests. Machine Learning, 2001: 5-32 ISSN 1573-0565. [RCA] [DOI] [Full Text] [Cited by in Crossref: 56052] [Cited by in RCA: 34116] [Article Influence: 2843.0] [Reference Citation Analysis (0)] |
| 11. | F Wenzel, T Galy-Fajou, M Deutsch, and M Kloft. Bayesian nonlinear support vector machines for big data. In ECML/PKDD, pages 10–20, 2017.. [DOI] [Full Text] |
| 12. | Vapnik VN. The Nature of Statistical Learning Theory. Springer: New York, USA, 1995. [RCA] [DOI] [Full Text] [Cited by in Crossref: 15299] [Cited by in RCA: 3674] [Article Influence: 108.1] [Reference Citation Analysis (0)] |
| 13. | Arlot S, Celisse A. A survey of cross-validation procedures for model selection. Statistics Surveys. 2010;4:40-79. [RCA] [DOI] [Full Text] [Cited by in Crossref: 2141] [Cited by in RCA: 2207] [Article Influence: 147.1] [Reference Citation Analysis (0)] |
| 14. | Sokolova M, Lapalme G. A systematic analysis of performance measures for classification tasks. Information Processing and Management. 2009;45:427-437. [RCA] [DOI] [Full Text] [Cited by in Crossref: 2621] [Cited by in RCA: 1508] [Article Influence: 94.3] [Reference Citation Analysis (0)] |
| 15. | Gomes P, du Boulay C, Smith CL, Holdstock G. Relationship between disease activity indices and colonoscopic findings in patients with colonic inflammatory bowel disease. Gut. 1986;27:92-95. [RCA] [PubMed] [DOI] [Full Text] [Cited by in Crossref: 253] [Cited by in RCA: 257] [Article Influence: 6.6] [Reference Citation Analysis (0)] |
| 16. | Mosli MH, Feagan BG, Sandborn WJ, Dʼhaens G, Behling C, Kaplan K, Driman DK, Shackelton LM, Baker KA, Macdonald JK, Vandervoort MK, Geboes K, Levesque BG. Histologic evaluation of ulcerative colitis: a systematic review of disease activity indices. Inflamm Bowel Dis. 2014;20:564-575. [RCA] [PubMed] [DOI] [Full Text] [Cited by in Crossref: 106] [Cited by in RCA: 96] [Article Influence: 8.7] [Reference Citation Analysis (0)] |
| 17. | Bumgarner R. Overview of DNA microarrays: types, applications, and their future. Curr Protoc Mol Biol. 2013;Chapter 22:Unit 22.1.. [RCA] [PubMed] [DOI] [Full Text] [Cited by in Crossref: 192] [Cited by in RCA: 188] [Article Influence: 15.7] [Reference Citation Analysis (0)] |
| 18. | Jolliffe IT. Principal Component Analysis. 2nd ed. Springer-Verlag, 2002. [RCA] [DOI] [Full Text] [Cited by in Crossref: 331] [Cited by in RCA: 125] [Article Influence: 3.2] [Reference Citation Analysis (0)] |
| 19. | Gan L, Denecke B. Profiling Pre-MicroRNA and Mature MicroRNA Expressions Using a Single Microarray and Avoiding Separate Sample Preparation. Microarrays (Basel). 2013;2:24-33. [RCA] [PubMed] [DOI] [Full Text] [Full Text (PDF)] [Cited by in Crossref: 15] [Cited by in RCA: 19] [Article Influence: 1.6] [Reference Citation Analysis (0)] |
| 20. | Smyth GK. Linear models and empirical bayes methods for assessing differential expression in microarray experiments. Stat Appl Genet Mol Biol. 2004;3:Article3. [RCA] [PubMed] [DOI] [Full Text] [Cited by in Crossref: 7784] [Cited by in RCA: 8791] [Article Influence: 418.6] [Reference Citation Analysis (0)] |
| 21. | Rice JA. Mathematical Statistics and Data Analysis. 2nd ed. Wadsworth Publishing Co Inc, 1994. [RCA] [DOI] [Full Text] [Cited by in Crossref: 1] [Cited by in RCA: 1] [Article Influence: 0.0] [Reference Citation Analysis (0)] |
| 22. | Barker M, Rayens W. Partial least squares for discrimination. Journal of Chemometrics. 2003;17:166-73. [DOI] [Full Text] |
| 23. | Rohart F, Gautier B, Singh A, Lê Cao KA. mixOmics: An R package for 'omics feature selection and multiple data integration. PLoS Comput Biol. 2017;13:e1005752. [RCA] [PubMed] [DOI] [Full Text] [Full Text (PDF)] [Cited by in Crossref: 2024] [Cited by in RCA: 2088] [Article Influence: 261.0] [Reference Citation Analysis (0)] |
| 24. | Melkumova LE, Shatskikh SY. Comparing Ridge and LASSO estimators for data analysis. Procedia Engineering. 2017;201:746-755. [RCA] [DOI] [Full Text] [Cited by in Crossref: 57] [Cited by in RCA: 47] [Article Influence: 5.9] [Reference Citation Analysis (0)] |
| 25. | A Statnikov, D Hardin, and C Aliferis. Using SVM weight-based methods to identify causally relevant and non-causally relevant variables. Sign, 1(4):474–484, 2006.. [RCA] [DOI] [Full Text] [Cited by in Crossref: 1] [Cited by in RCA: 1] [Article Influence: 0.2] [Reference Citation Analysis (0)] |
| 26. | Liaw A, Wiener M. Classification and regression by randomforest. R News. 2002. Available from https://www.r-project.org/doc/Rnews/Rnews_2002-3.pdf. |
| 27. | Wei P, Lu Z, Song J. Variable importance analysis: A comprehensive review. Reliability Engineering and System Safety. 2015;142:399-432. [DOI] [Full Text] |
| 28. | Kuhn M. Building predictive models in r using the caret package. Journal of statistical software. 2008;5:1-26. [RCA] [DOI] [Full Text] [Cited by in Crossref: 3251] [Cited by in RCA: 3275] [Article Influence: 192.6] [Reference Citation Analysis (0)] |
| 29. | Sachs MC. plotROC: A Tool for Plotting ROC Curves. J Stat Softw. 2017;79. [RCA] [PubMed] [DOI] [Full Text] [Cited by in Crossref: 82] [Cited by in RCA: 186] [Article Influence: 23.3] [Reference Citation Analysis (0)] |
| 30. | Damião AOMC, de Azevedo MFC, Carlos AS, Wada MY, Silva TVM, Feitosa FC. Conventional therapy for moderate to severe inflammatory bowel disease: A systematic literature review. World J Gastroenterol. 2019;25:1142-1157. [RCA] [PubMed] [DOI] [Full Text] [Full Text (PDF)] [Cited by in CrossRef: 48] [Cited by in RCA: 62] [Article Influence: 10.3] [Reference Citation Analysis (0)] |
| 31. | Cross RK, Farraye FA. IBD management: Stat of the art in 2018. Gastroenterology & Hepatology. 2018;11:6. [DOI] [Full Text] |
| 32. | Lucafò M, Curci D, Franzin M, Decorti G, Stocco G. Inflammatory Bowel Disease and Risk of Colorectal Cancer: An Overview From Pathophysiology to Pharmacological Prevention. Front Pharmacol. 2021;12:772101. [RCA] [PubMed] [DOI] [Full Text] [Full Text (PDF)] [Cited by in Crossref: 74] [Cited by in RCA: 74] [Article Influence: 18.5] [Reference Citation Analysis (0)] |
| 33. | Ishimaru K, Tominaga T, Nonaka T, Fukuda A, Moriyama M, Oyama S, Ishii M, Sawai T, Nagayasu T. Colorectal cancer in Crohn's disease: a series of 6 cases. Surg Case Rep. 2021;7:152. [RCA] [PubMed] [DOI] [Full Text] [Full Text (PDF)] [Cited by in Crossref: 1] [Cited by in RCA: 4] [Article Influence: 1.0] [Reference Citation Analysis (0)] |
| 34. | Grillo TG, Quaglio AEV, Beraldo RF, Lima TB, Baima JP, Di Stasi LC, Sassaki LY. MicroRNA expression in inflammatory bowel disease-associated colorectal cancer. World J Gastrointest Oncol. 2021;13:995-1016. [RCA] [PubMed] [DOI] [Full Text] [Full Text (PDF)] [Cited by in CrossRef: 8] [Cited by in RCA: 6] [Article Influence: 1.5] [Reference Citation Analysis (0)] |
| 35. | Yu M, Luo Y, Cong Z, Mu Y, Qiu Y, Zhong M. MicroRNA-590-5p Inhibits Intestinal Inflammation by Targeting YAP. J Crohns Colitis. 2018;12:993-1004. [RCA] [PubMed] [DOI] [Full Text] [Cited by in Crossref: 32] [Cited by in RCA: 43] [Article Influence: 6.1] [Reference Citation Analysis (0)] |
| 36. | Bocchetti M, Ferraro MG, Ricciardiello F, Ottaiano A, Luce A, Cossu AM, Scrima M, Leung WY, Abate M, Stiuso P, Caraglia M, Zappavigna S, Yau TO. The Role of microRNAs in Development of Colitis-Associated Colorectal Cancer. Int J Mol Sci. 2021;22. [RCA] [PubMed] [DOI] [Full Text] [Full Text (PDF)] [Cited by in Crossref: 33] [Cited by in RCA: 31] [Article Influence: 7.8] [Reference Citation Analysis (0)] |
| 37. | Vogel JD, Eskicioglu C, Weiser MR, Feingold DL, Steele SR. The American Society of Colon and Rectal Surgeons Clinical Practice Guidelines for the Treatment of Colon Cancer. Dis Colon Rectum. 2017;60:999-1017. [RCA] [PubMed] [DOI] [Full Text] [Cited by in Crossref: 190] [Cited by in RCA: 226] [Article Influence: 28.3] [Reference Citation Analysis (0)] |
| 38. | Luzietti E, Pellino G, Nikolaou S, Qiu S, Mills S, Warren O, Tekkis P, Kontovounisios C. Comparison of guidelines for the management of rectal cancer. BJS Open. 2018;2:433-451. [RCA] [PubMed] [DOI] [Full Text] [Full Text (PDF)] [Cited by in Crossref: 27] [Cited by in RCA: 33] [Article Influence: 4.7] [Reference Citation Analysis (1)] |