Copyright
©The Author(s) 2020.
World J Meta-Anal. Mar 28, 2020; 8(2): 78-88
Published online Mar 28, 2020. doi: 10.13105/wjma.v8.i2.78
Published online Mar 28, 2020. doi: 10.13105/wjma.v8.i2.78
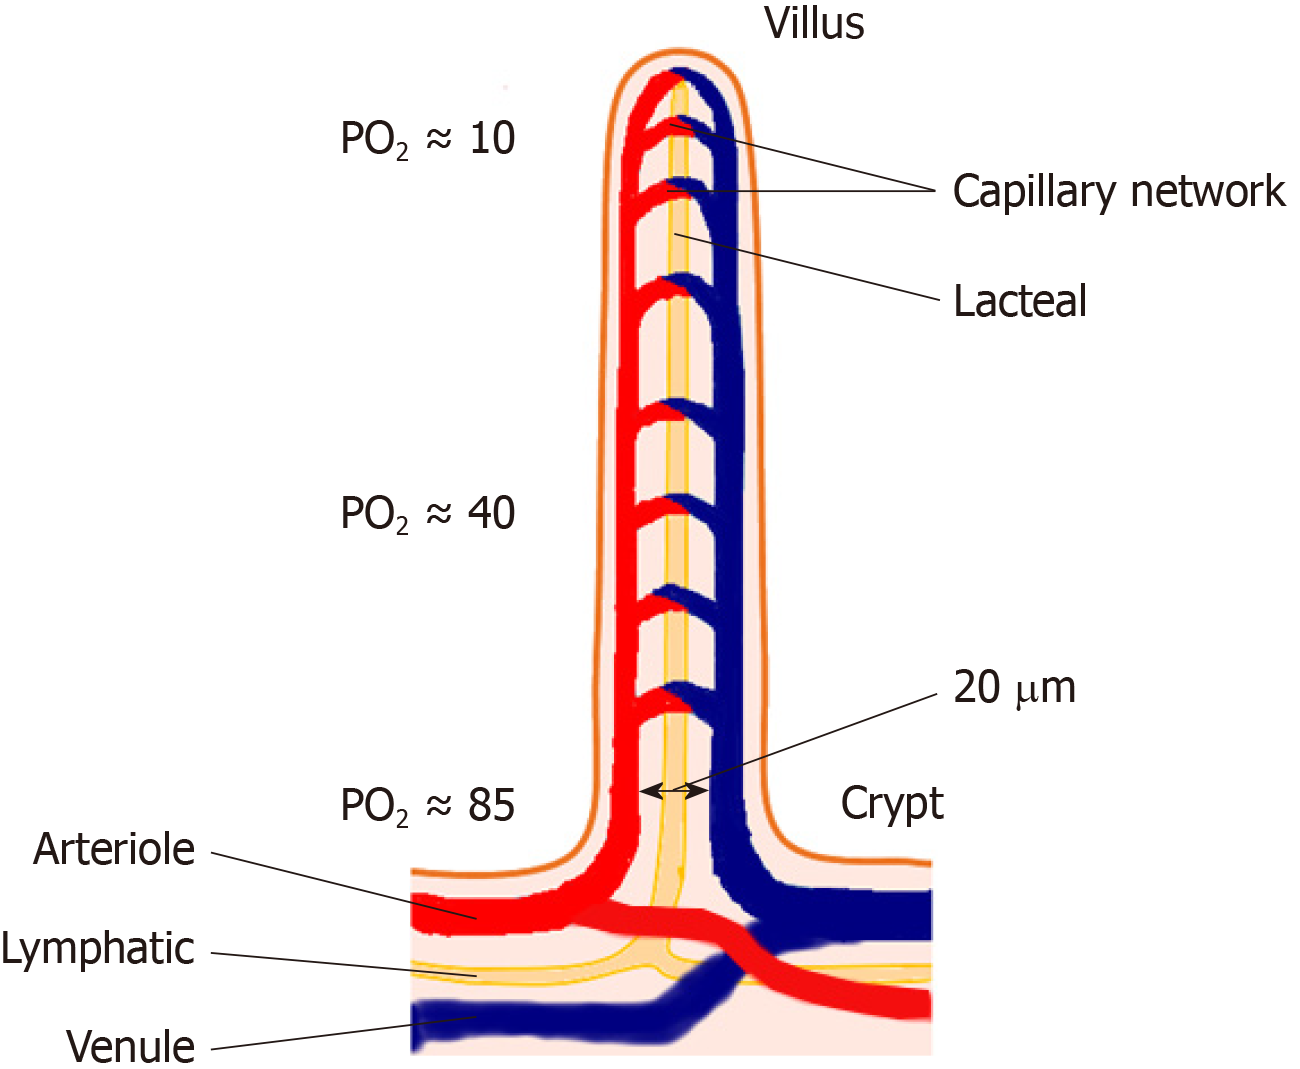
Figure 1 Schematic diagram of countercurrent blood flow within the small intestinal villus allowing diffusion of O2 from the arteriole to the venule, creating a luminal hypoxia from the crypt to the villous tip.
PO2 is shown in mmHg.
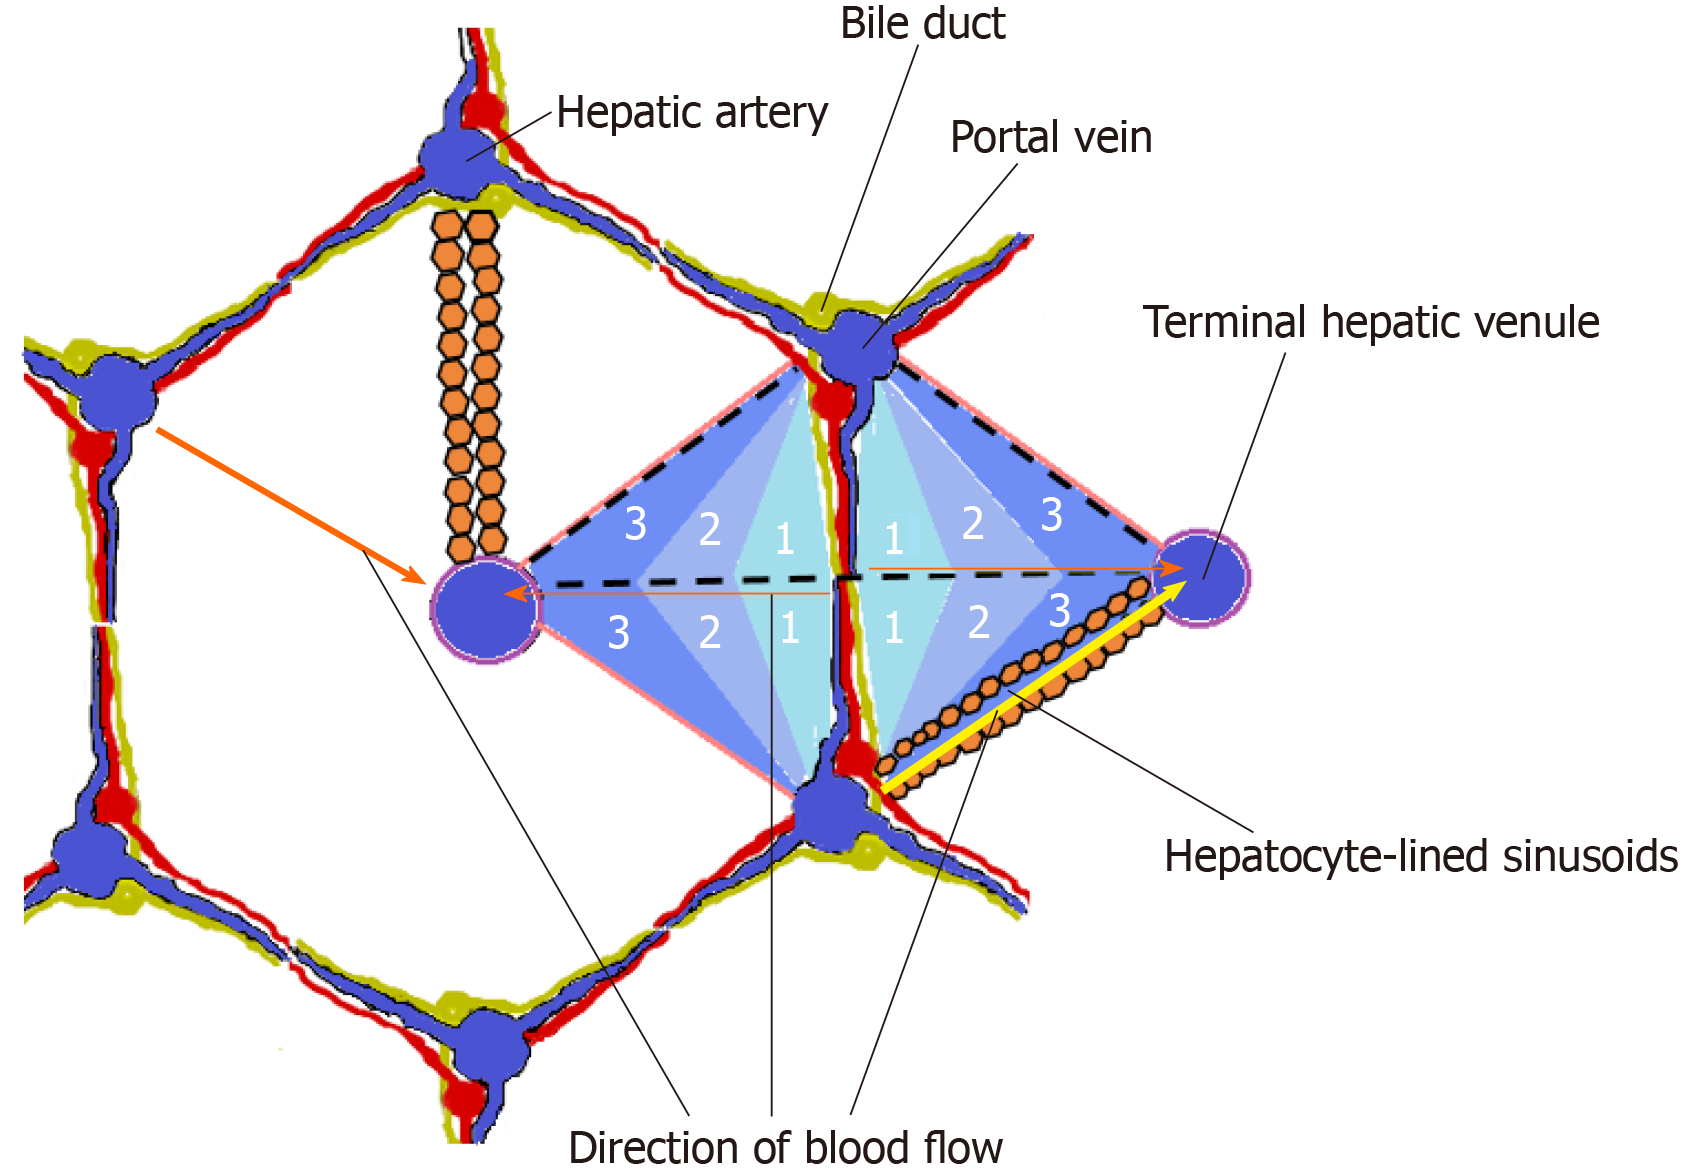
Figure 2 Schematic representation of a hepatic acinus within a conventional hepatic lobule.
The demarcation of the hepatic acinus is shown by the dashed lines. Arrows indicate the direction of blood flow within hepatic sinusoids in a periportal-to-perivenous direction, giving rise to zones 1, 2 and 3 (numbered) within the acinus. Note that all three zones are represented in a single sinusoid.
Figure 3 Production of adenosine from adenine nucleotides.
ATP: Adenosine triphosphate; ADP: Adenosine diphosphate; AMP: Adenosine monophosphate; Pi: Inorganic phosphate; AK: Adenosine kinase.
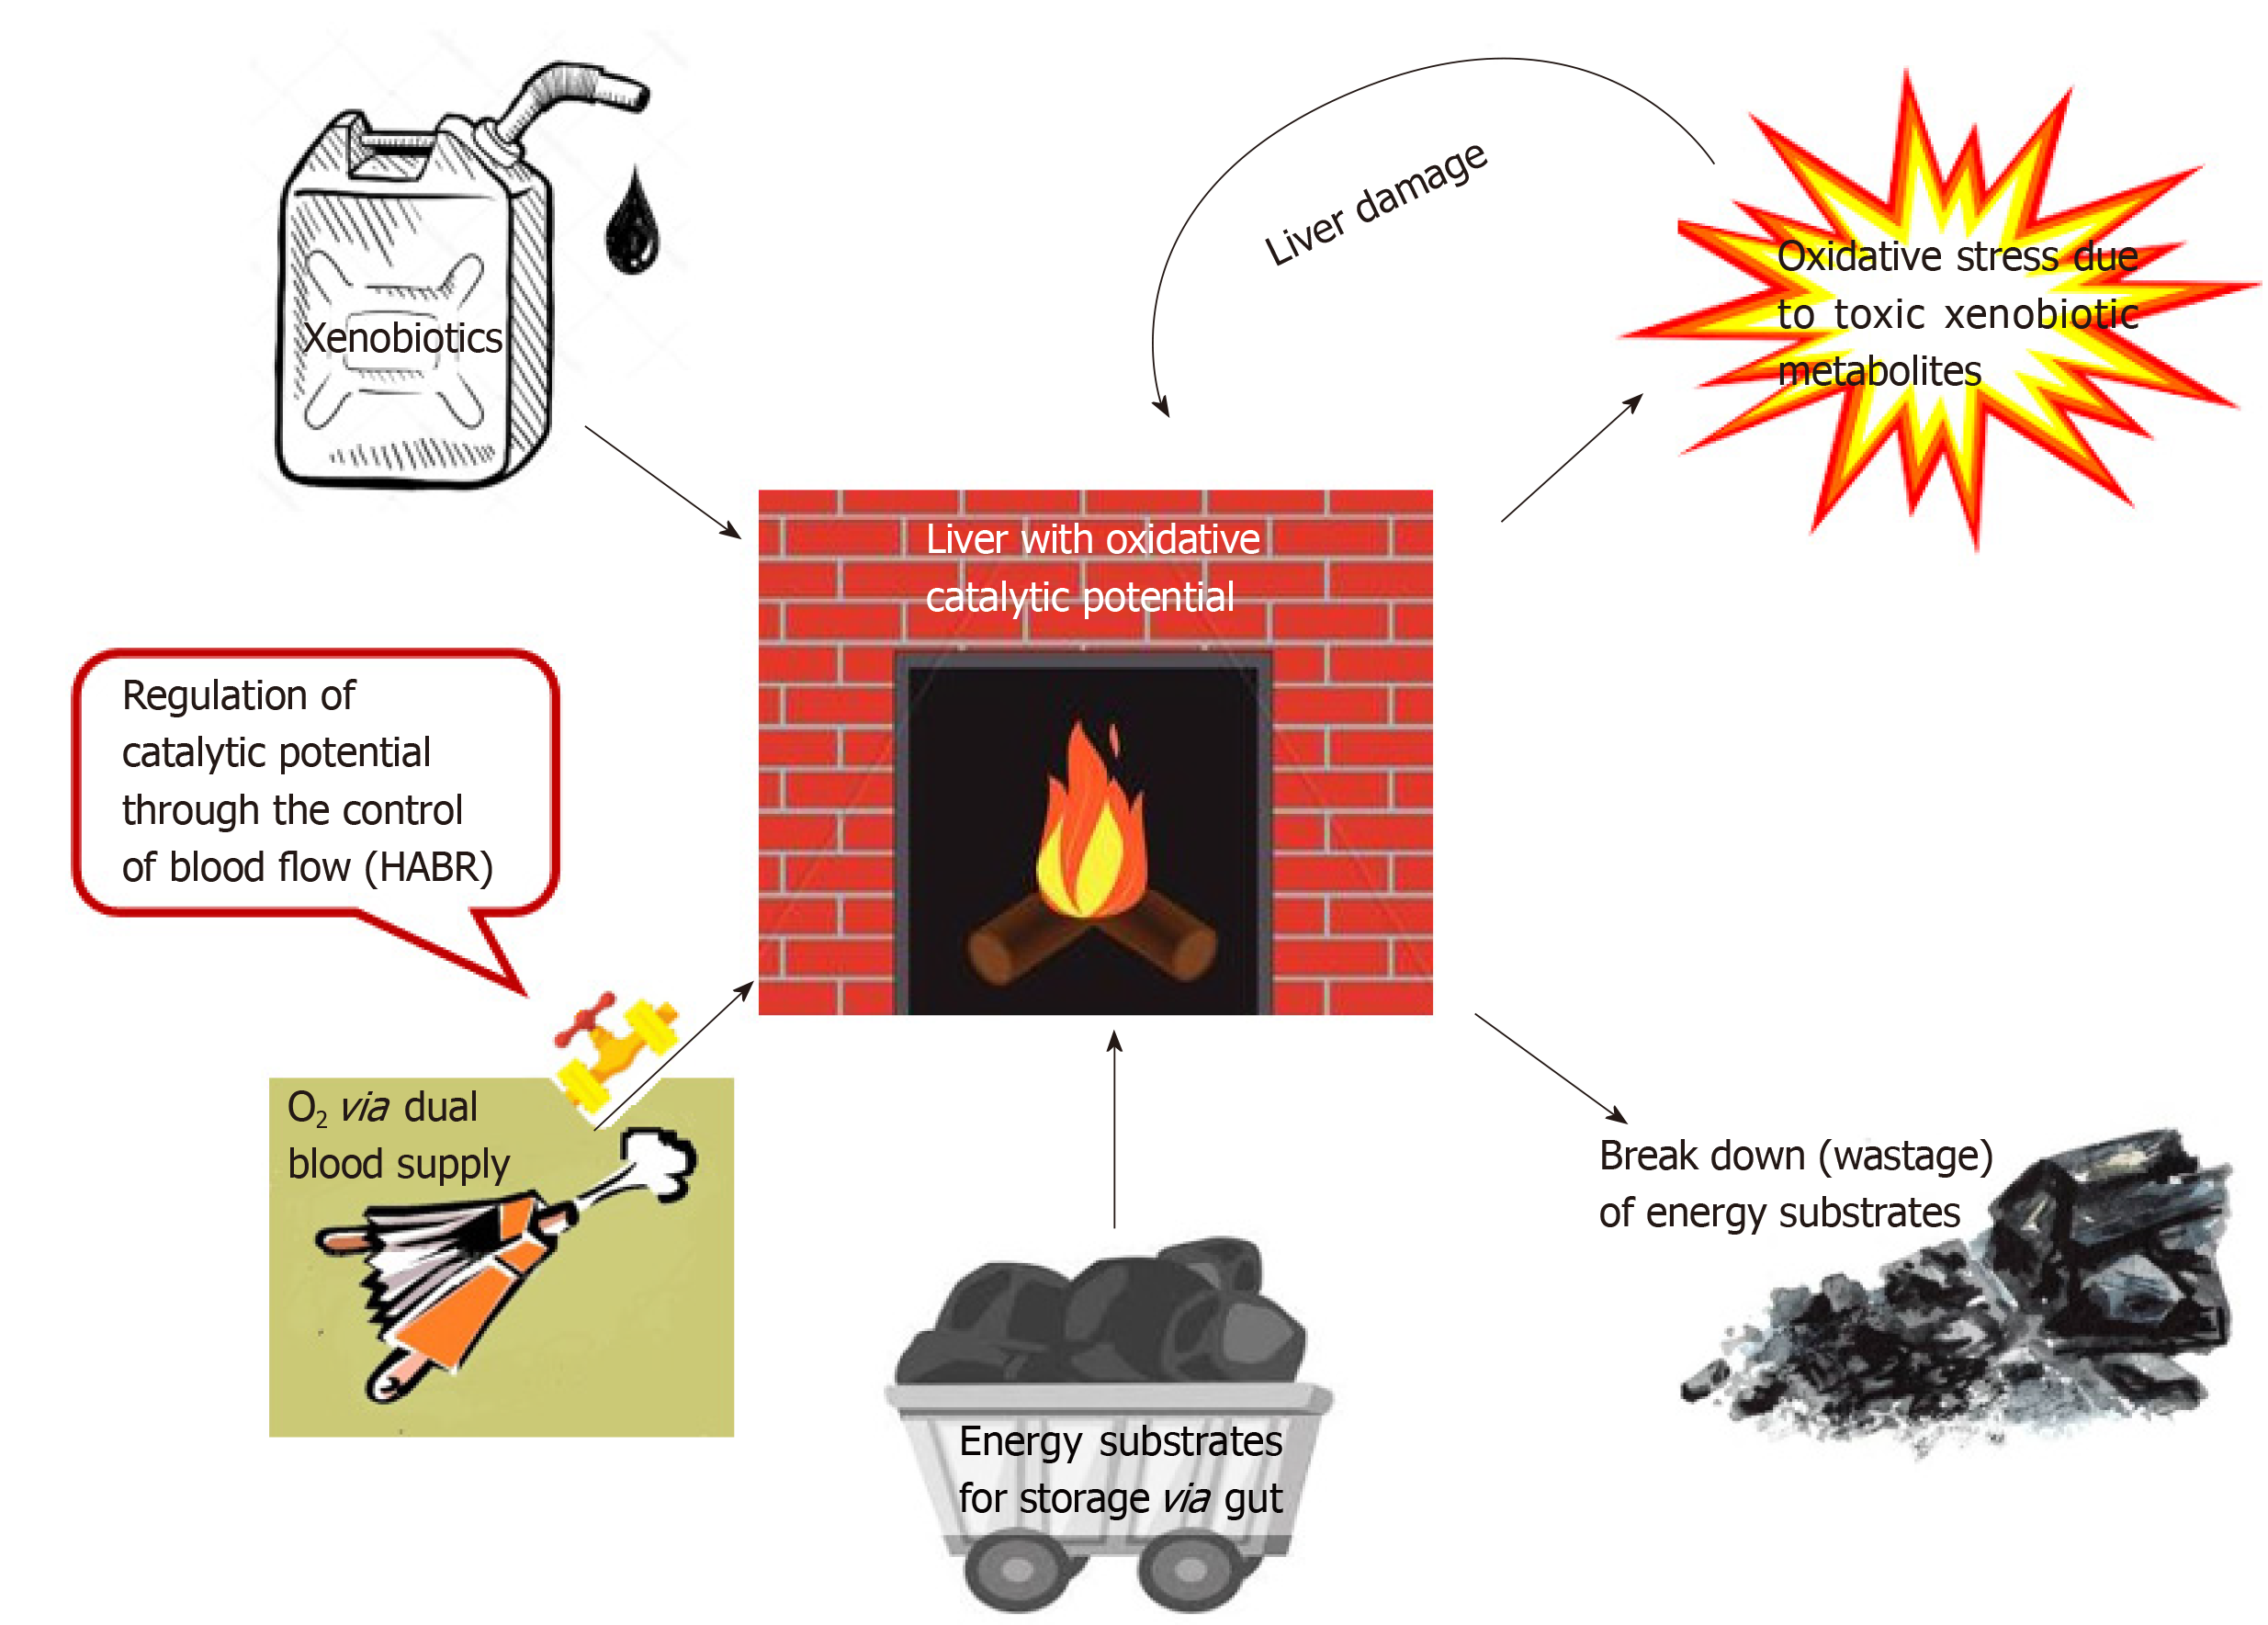
Figure 4 Liver as the “chemical smithy” of the body.
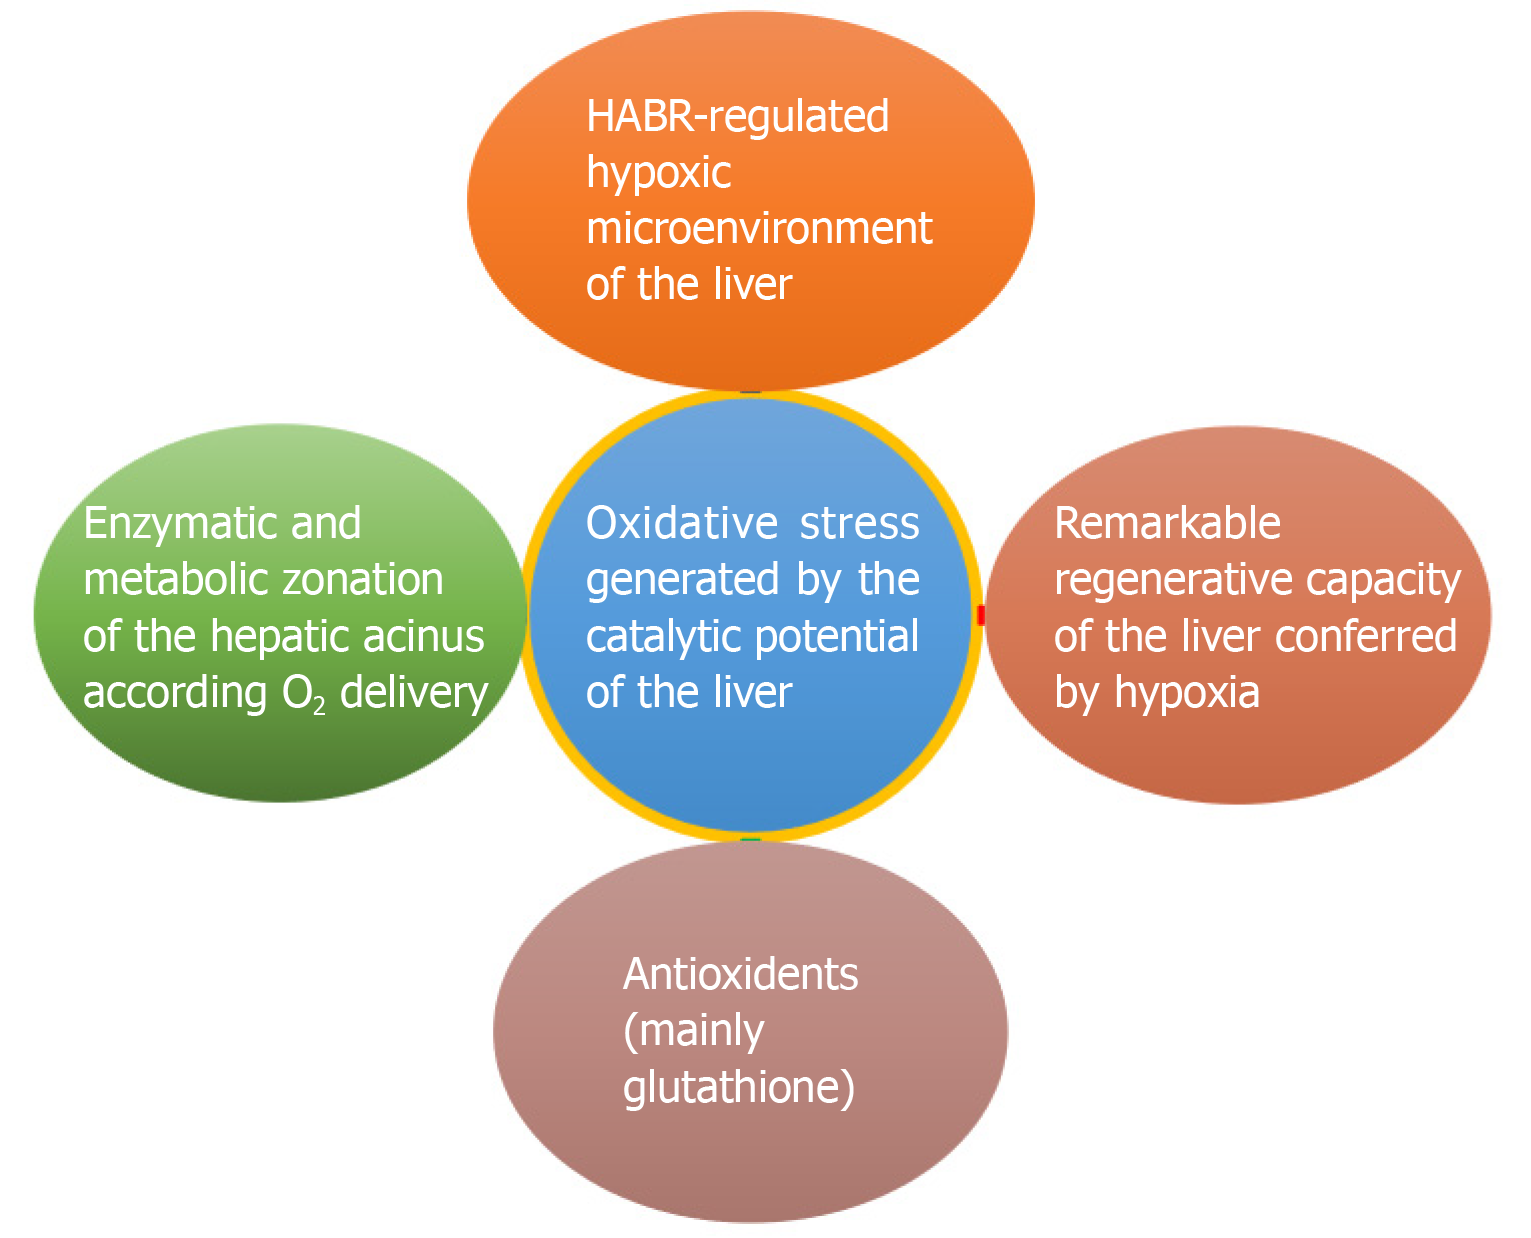
Figure 5 Protective adaptations of the liver against oxidative stress.
HABR: Hepatic arterial buffer response.
- Citation: Hewawasam SP. Hypoxia and oxidative stress: The role of the anaerobic gut, the hepatic arterial buffer response and other defence mechanisms of the liver. World J Meta-Anal 2020; 8(2): 78-88
- URL: https://www.wjgnet.com/2308-3840/full/v8/i2/78.htm
- DOI: https://dx.doi.org/10.13105/wjma.v8.i2.78


