Copyright
©The Author(s) 2019.
World J Meta-Anal. Jun 30, 2019; 7(6): 309-322
Published online Jun 30, 2019. doi: 10.13105/wjma.v7.i6.309
Published online Jun 30, 2019. doi: 10.13105/wjma.v7.i6.309
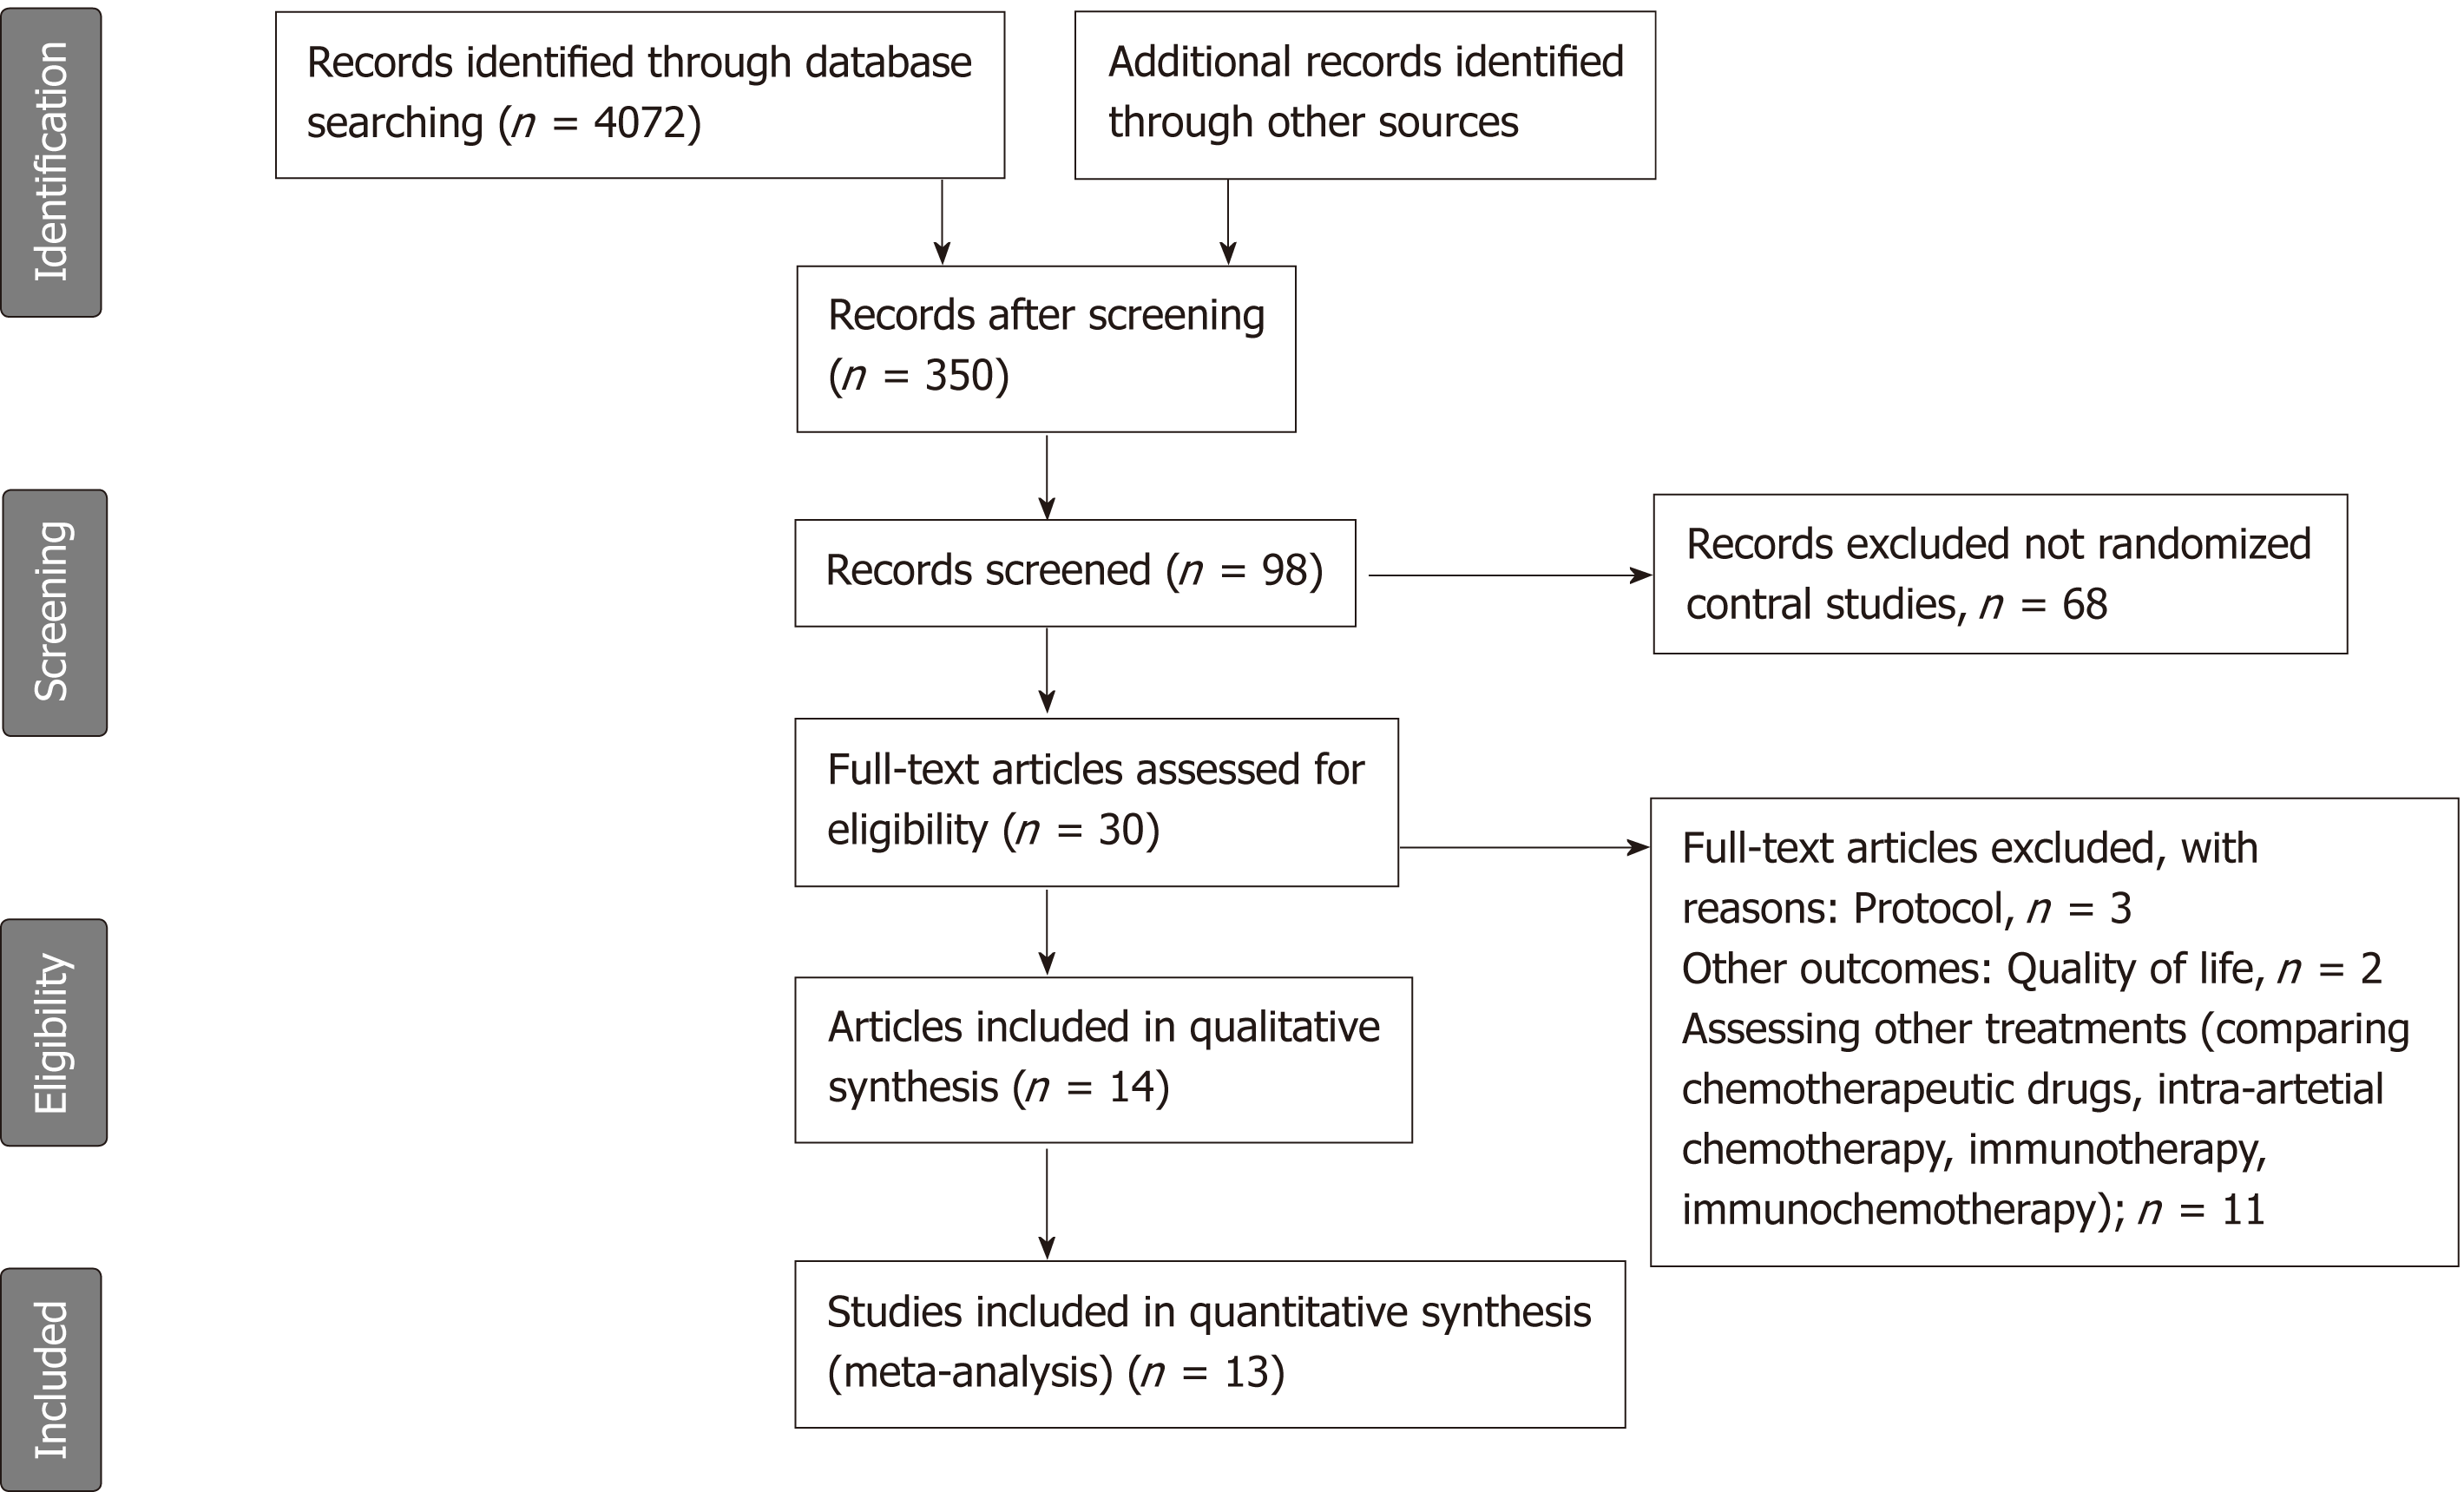
Figure 1 PRISMA flow chart of literature search showing the identification, screening, eligibility, and inclusion phases of the search.
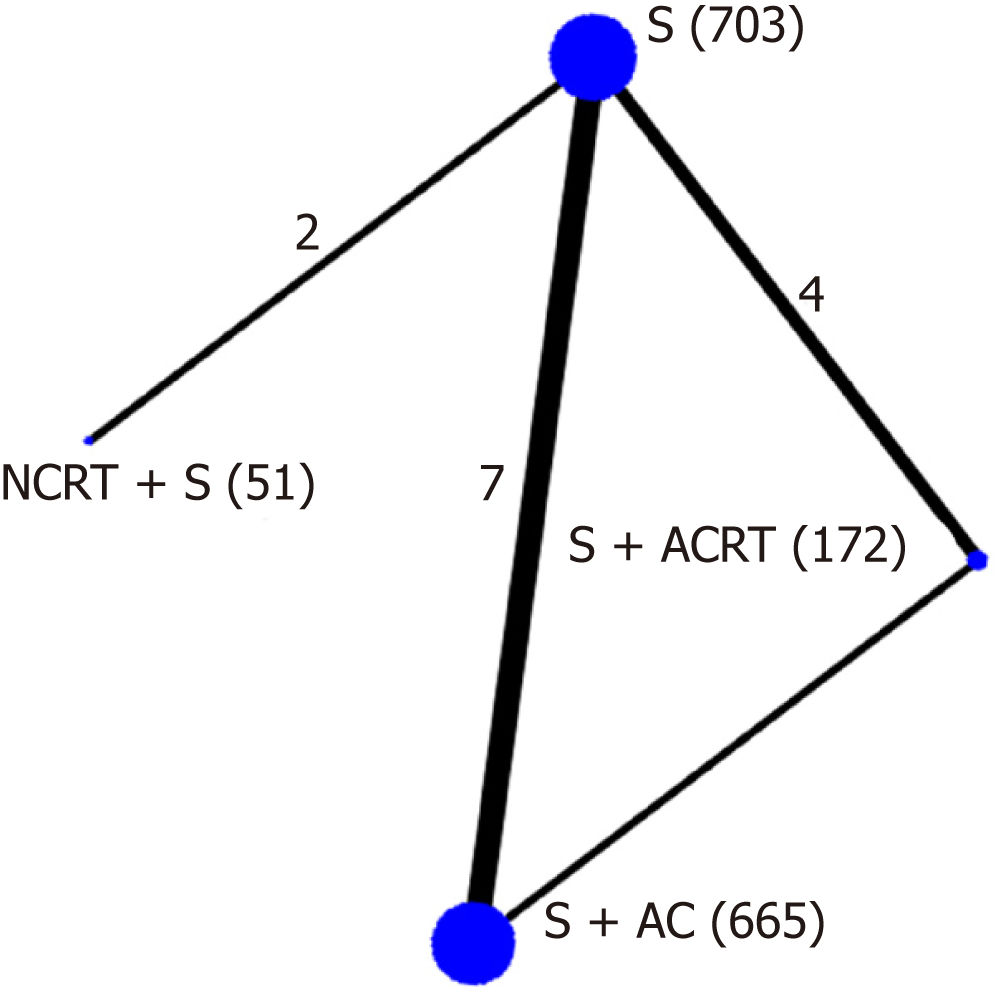
Figure 2 Network plot.
Network plot showing the following different treatment strategies for resectable pancreatic cancer: neoadjuvant chemoradiotherapy with surgery (NCRT + S) (n = 51), surgery alone (S) (n = 703), surgery with adjuvant chemotherapy (S + ACT) (n = 665), or surgery with adjuvant chemoradiotherapy (S + ACRT) (n = 172).
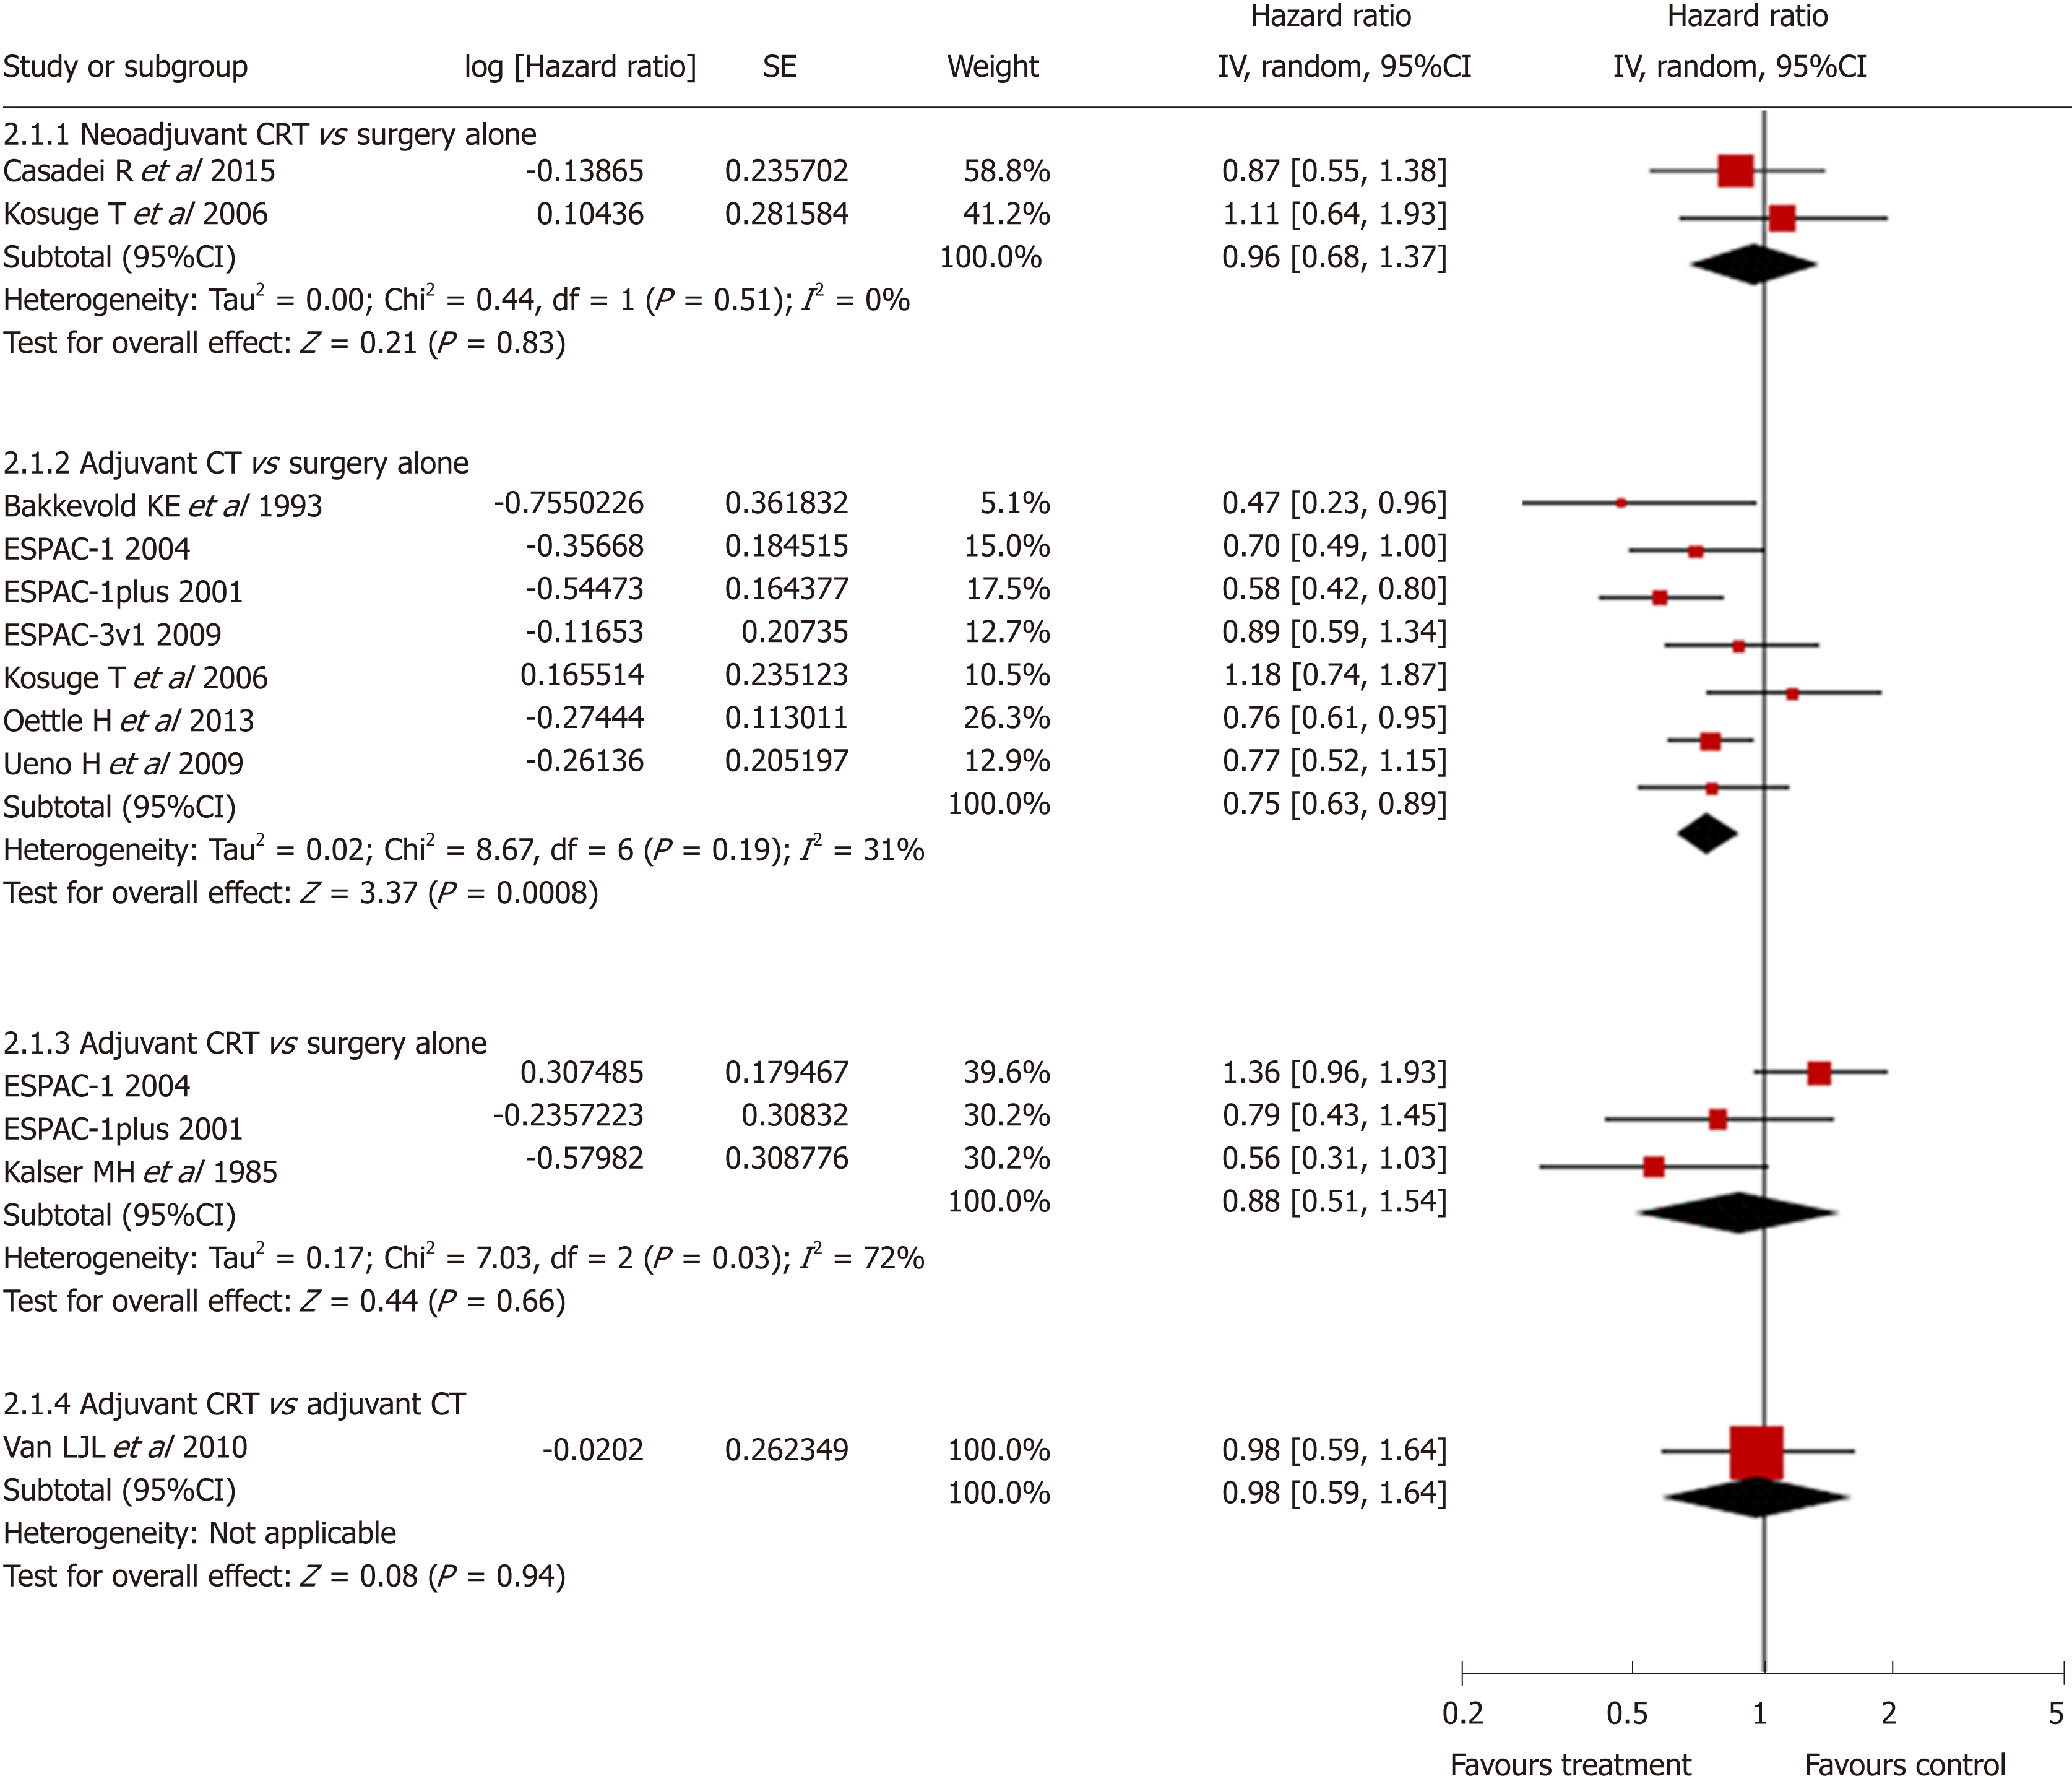
Figure 3 Forest plot of direct comparison meta-analysis of overall survival.
Squares and horizontal lines correspond to the study-specific HRs and 95% CIs, respectively. The area of the squares correlates with the weight of each enrolled study, and the diamonds represent the summary HRs and 95% CIs. HRs: Hazard ratios; CI: Confidence interval.
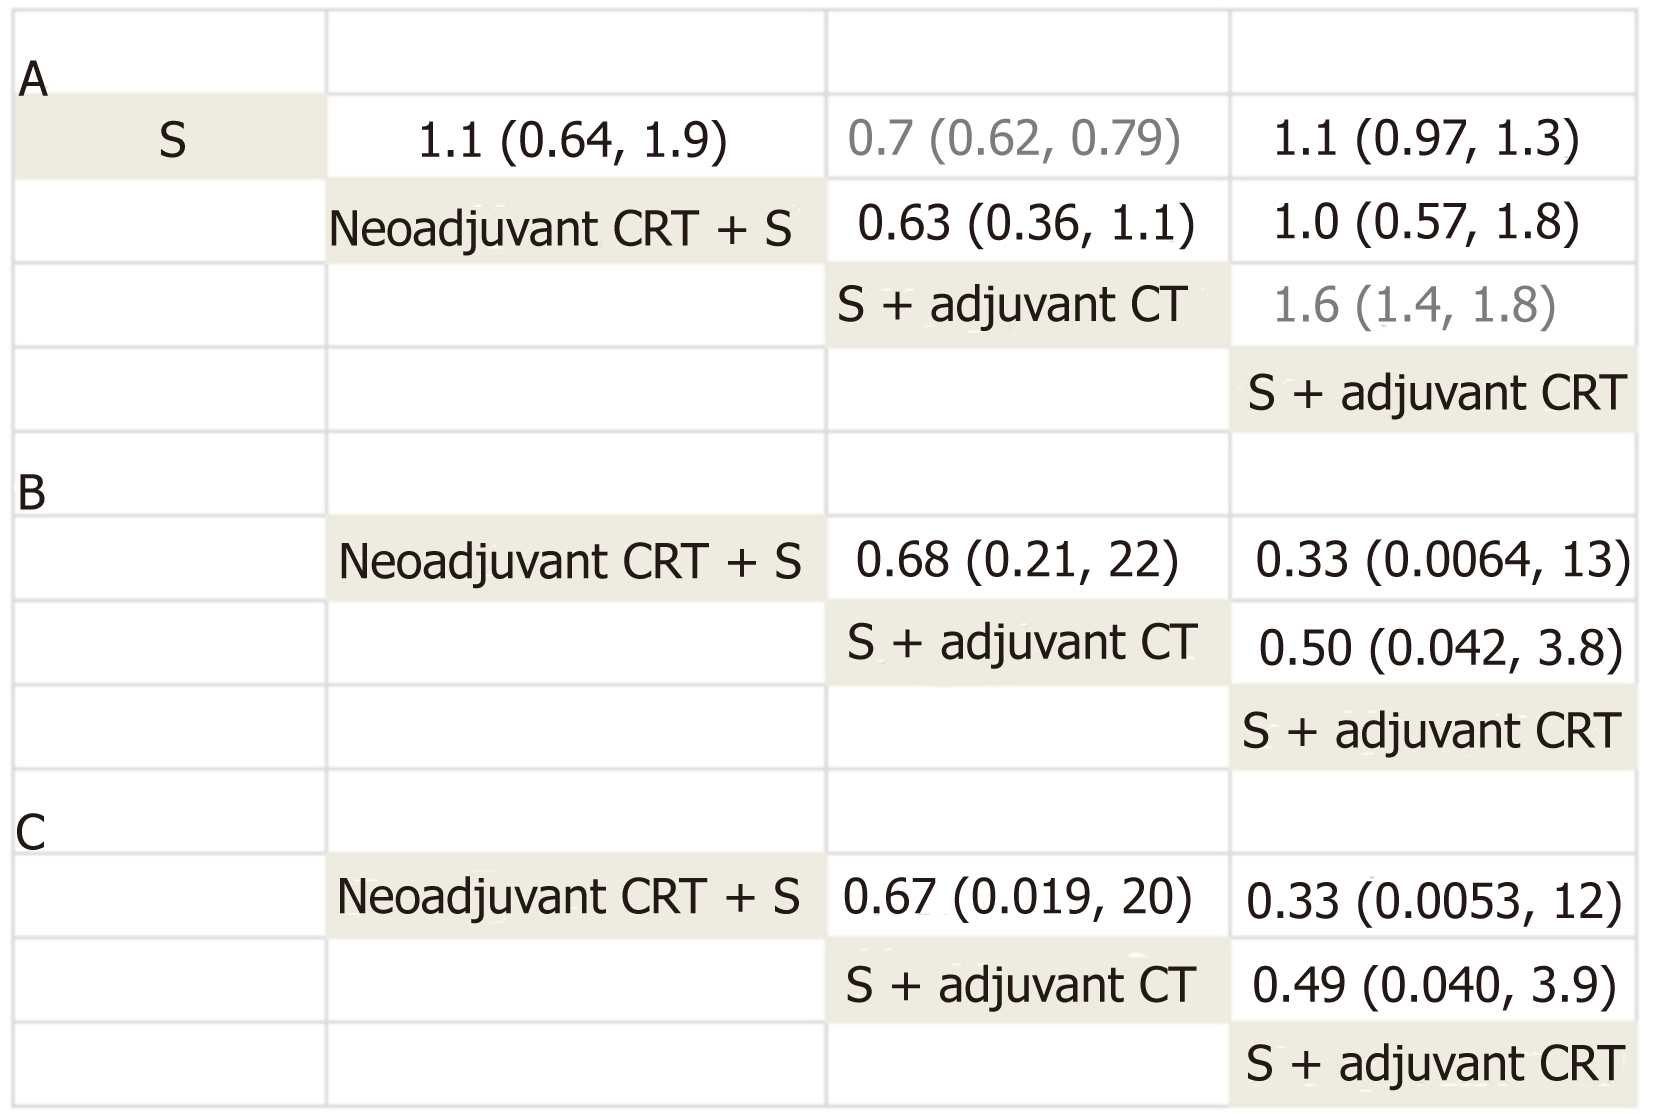
Figure 4 Network meta-analysis of overall survival (A), overall toxicity (B), and haematological toxicity (C).
The column treatment is compared with the row treatment. Overall survival was estimated using pooled hazard ratios and 95% confidence intervals. Toxicity was estimated using pooled odds ratios and 95% confidence intervals.
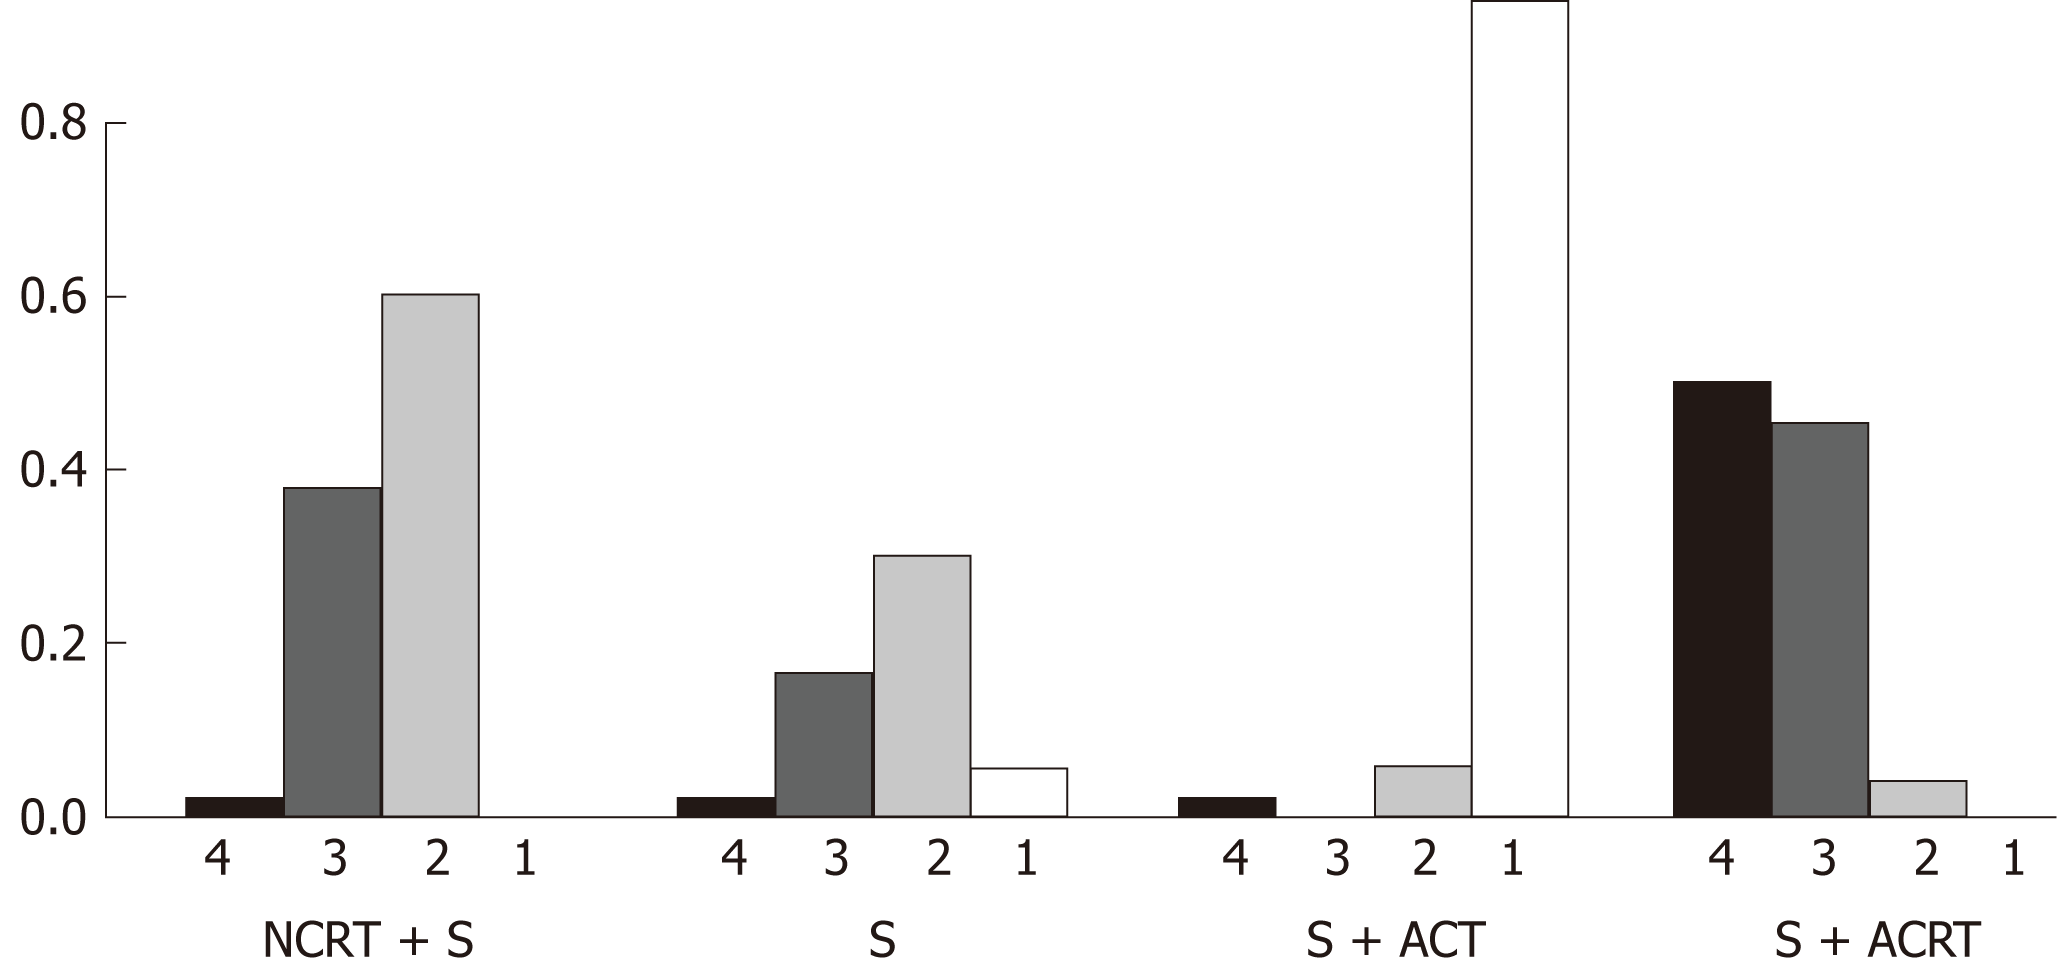
Figure 5 Rankogram of overall survival.
The height of column represents the probability of ranking the first (1) second (2), third (3), and fourth (4). NCRT + S: Neoadjuvant chemoradiotherapy with surgery; S: Surgery alone; S + ACT: Surgery with adjuvant chemotherapy; S + ACRT: Surgery with adjuvant chemoradiotherapy.
- Citation: Shen P, Huang KJ, Zhang CZ, Xiao L, Zhang T. Surgery with adjuvant or neoadjuvant treatment vs surgery alone for resectable pancreatic cancer: A network meta-analysis. World J Meta-Anal 2019; 7(6): 309-322
- URL: https://www.wjgnet.com/2308-3840/full/v7/i6/309.htm
- DOI: https://dx.doi.org/10.13105/wjma.v7.i6.309


