Copyright
©The Author(s) 2015.
World J Meta-Anal. Feb 26, 2015; 3(1): 61-71
Published online Feb 26, 2015. doi: 10.13105/wjma.v3.i1.61
Published online Feb 26, 2015. doi: 10.13105/wjma.v3.i1.61
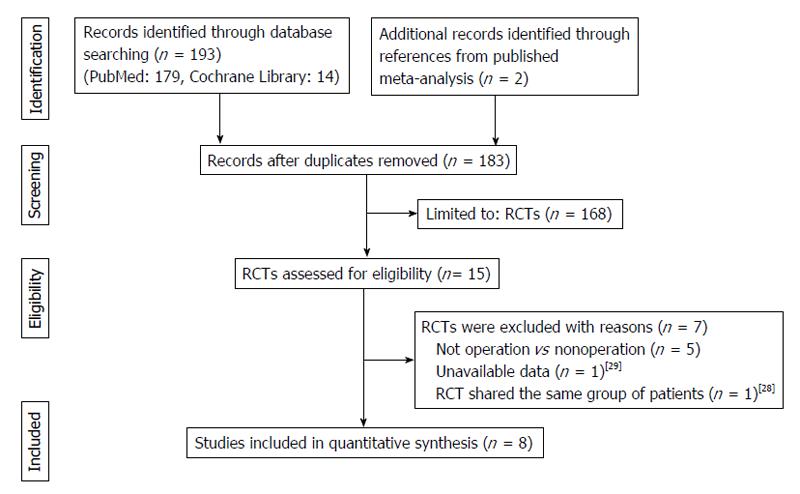
Figure 1 Flow chart of eligibility selection.
RCT: Randomized controlled trial.
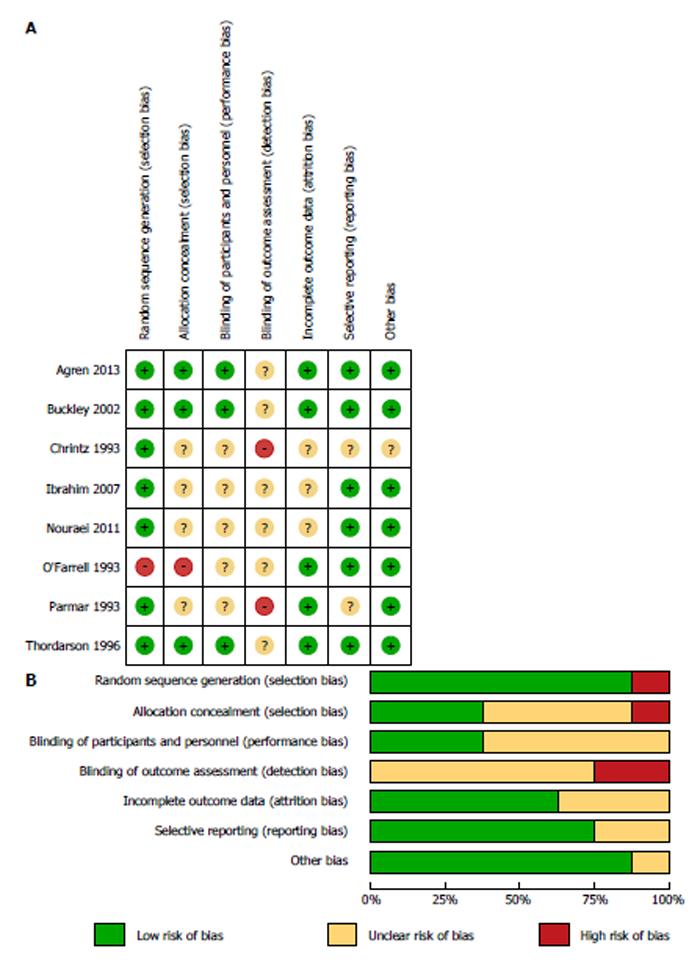
Figure 2 Risk of bias summary and graph.
A: Risk of bias summary; B: Risk of bias graph.
Figure 3 The number of patients who resumed pre-injury job after treatment.
Figure 4 The number of patients who had residual pain after treatment.
Figure 5 The number of patients who had shoe-fitting problems after treatment.
Figure 6 The number of patients who had limited walking distance after treatment.
Figure 7 The number of patients who had secondary late arthrodesis.
Figure 8 Incidence of complications after operative and nonoperative treatments.
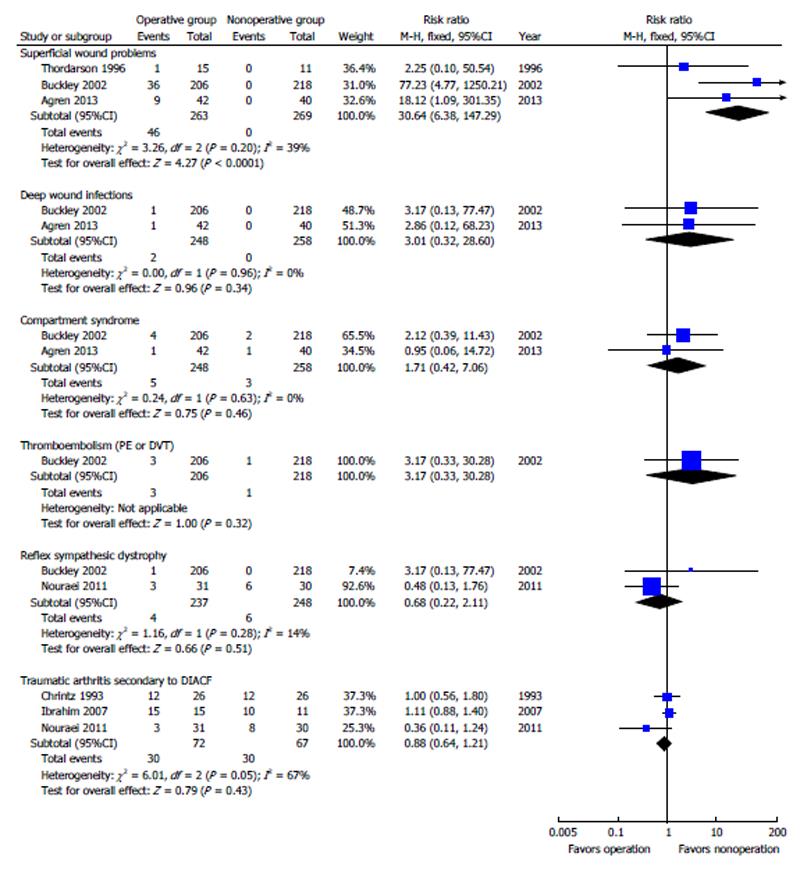
Figure 9 Subgroup analysis on specific complications.
DIACF: Displaced intra-articular calcaneal fracture; PE: Pulmonary embolism; DVT: Deep venous thrombosis.
Figure 10 Funnel plot based on studies with data on incidence of shoe-fitting problems.
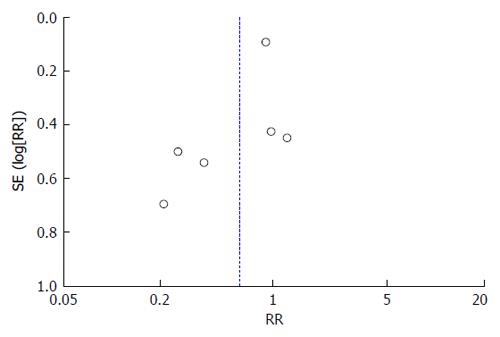
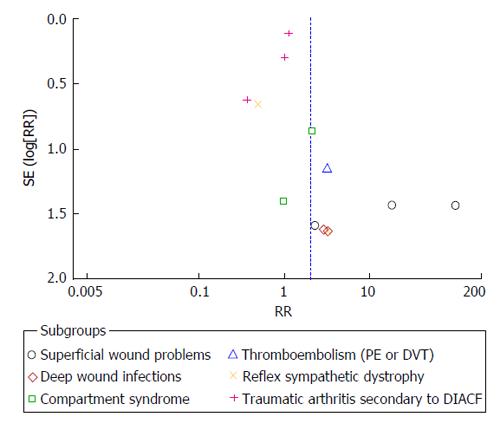
Figure 11 Funnel plot based on studies with data on subgroup analyses of complications.
DIACF: Displaced intra-articular calcaneal fracture; SE: Standard error; PE: Pulmonary embolism; DVT: Deep venous thrombosis.
-
Citation: Jiang N, Song HJ, Xie GP, Wang L, Liang CX, Qin CH, Yu B. Operative
vs nonoperative treatment of displaced intra-articular calcaneal fracture: A meta-analysis of randomized controlled trials. World J Meta-Anal 2015; 3(1): 61-71 - URL: https://www.wjgnet.com/2308-3840/full/v3/i1/61.htm
- DOI: https://dx.doi.org/10.13105/wjma.v3.i1.61


