Copyright
©The Author(s) 2015.
World J Meta-Anal. Feb 26, 2015; 3(1): 26-35
Published online Feb 26, 2015. doi: 10.13105/wjma.v3.i1.26
Published online Feb 26, 2015. doi: 10.13105/wjma.v3.i1.26
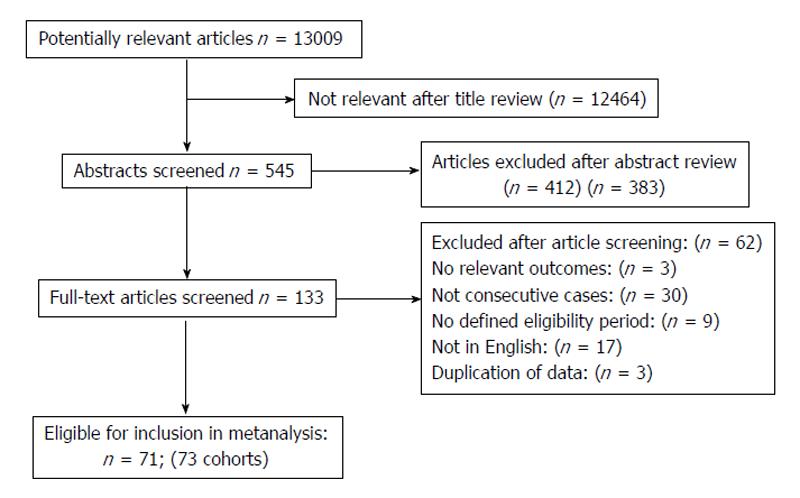
Figure 1 Summary of the results of the search.
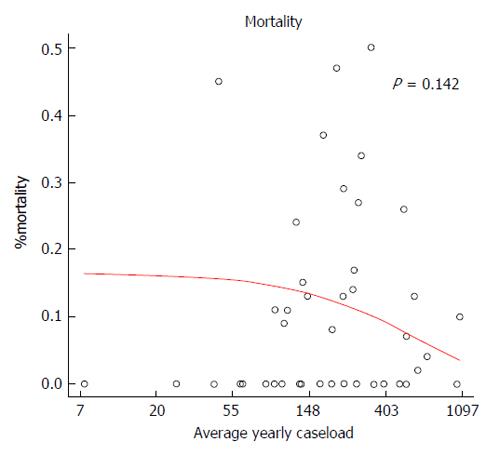
Figure 2 Scatterplot with regression line demonstrating the relationship between percentage mortality rate and average annual institutional volume of laparoscopic cholecystectomy (average caseload is plotted on a logarithmic scale).
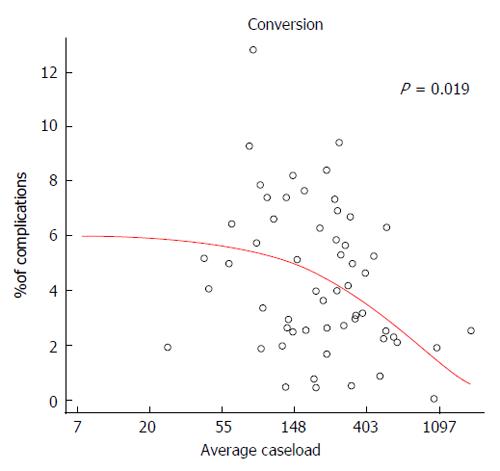
Figure 3 Scatterplot with regression line demonstrating the relationship between percentage conversion rate and average annual institutional volume of laparoscopic cholecystectomy (average caseload is plotted on a logarithmic scale).
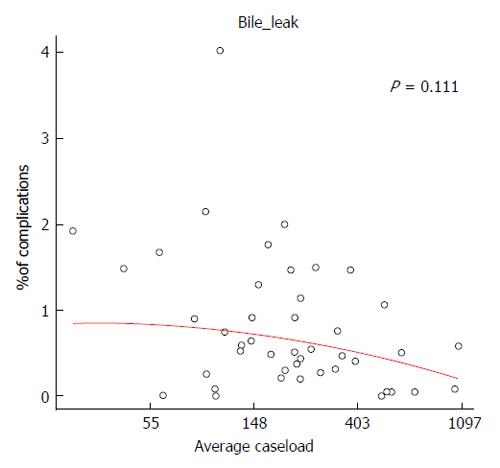
Figure 4 Scatterplot with regression line demonstrating the relationship between percentage bile leak rate and average annual institutional volume of laparoscopic cholecystectomy (average caseload is plotted on a logarithmic scale).
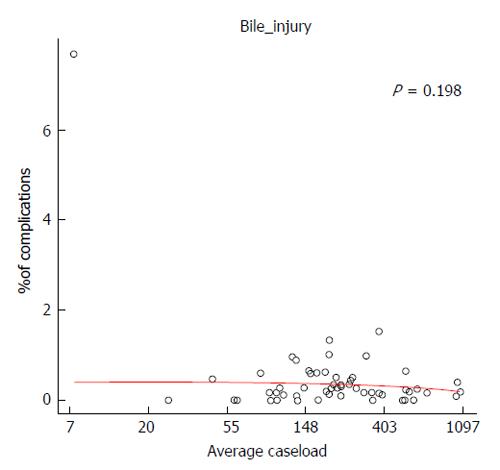
Figure 5 Scatterplot with regression line demonstrating the relationship between percentage bile duct injury rate and average annual institutional volume of laparoscopic cholecystectomy (average caseload is plotted on a logarithmic scale).
- Citation: Murray M, Healy DA, Ferguson J, Bashar K, McHugh S, Clarke Moloney M, Walsh SR. Effect of institutional volume on laparoscopic cholecystectomy outcomes: Systematic review and meta-analysis. World J Meta-Anal 2015; 3(1): 26-35
- URL: https://www.wjgnet.com/2308-3840/full/v3/i1/26.htm
- DOI: https://dx.doi.org/10.13105/wjma.v3.i1.26


