Copyright
©2014 Baishideng Publishing Group Inc.
World J Meta-Anal. Nov 26, 2014; 2(4): 221-227
Published online Nov 26, 2014. doi: 10.13105/wjma.v2.i4.221
Published online Nov 26, 2014. doi: 10.13105/wjma.v2.i4.221
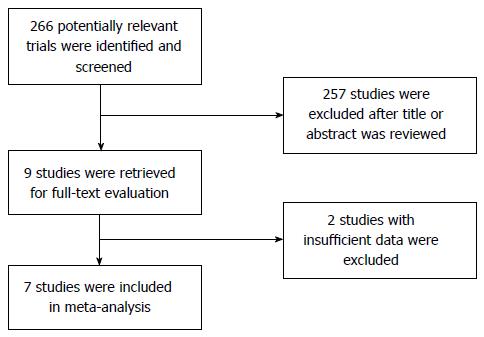
Figure 1 Process of study selection.
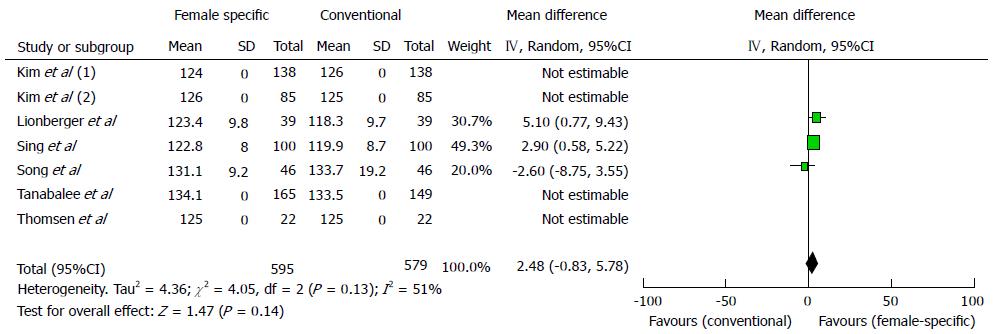
Figure 2 Forest plot of range of motion with female-specific vs conventional prostheses after total knee arthroplasty.
ROM in the female-specific prostheses group after TKA tended to be greater than the conventional prostheses group; however, with insignificant difference between the 2 groups. ROM: Range of motion; TKA: Total knee arthroplasty; SD: Standard deviation; CI: Confidence interval.
Figure 3 Forest plot of deep infection with female-specific vs conventional prostheses after total knee arthroplasty.
There was no significant significance between the 2 groups. CI: Confidence interval.
-
Citation: Rong GX, Huang L, Gui BJ, Xu AM, Zhang JL, Wang SS. Female-specific
vs conventional knee prostheses after total knee arthroplasty: A meta-analysis. World J Meta-Anal 2014; 2(4): 221-227 - URL: https://www.wjgnet.com/2308-3840/full/v2/i4/221.htm
- DOI: https://dx.doi.org/10.13105/wjma.v2.i4.221


