Copyright
©2014 Baishideng Publishing Group Inc.
World J Meta-Anal. Nov 26, 2014; 2(4): 194-203
Published online Nov 26, 2014. doi: 10.13105/wjma.v2.i4.194
Published online Nov 26, 2014. doi: 10.13105/wjma.v2.i4.194
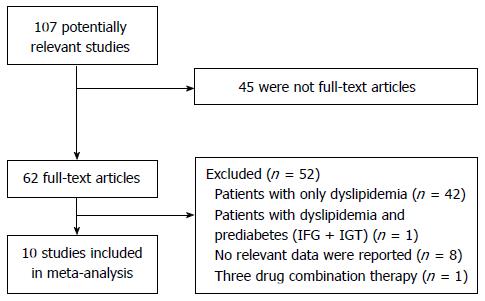
Figure 1 Flow diagram of study screening process.
IFG: Impaired fasting glucose; IGT: Impaired glucose tolerance.
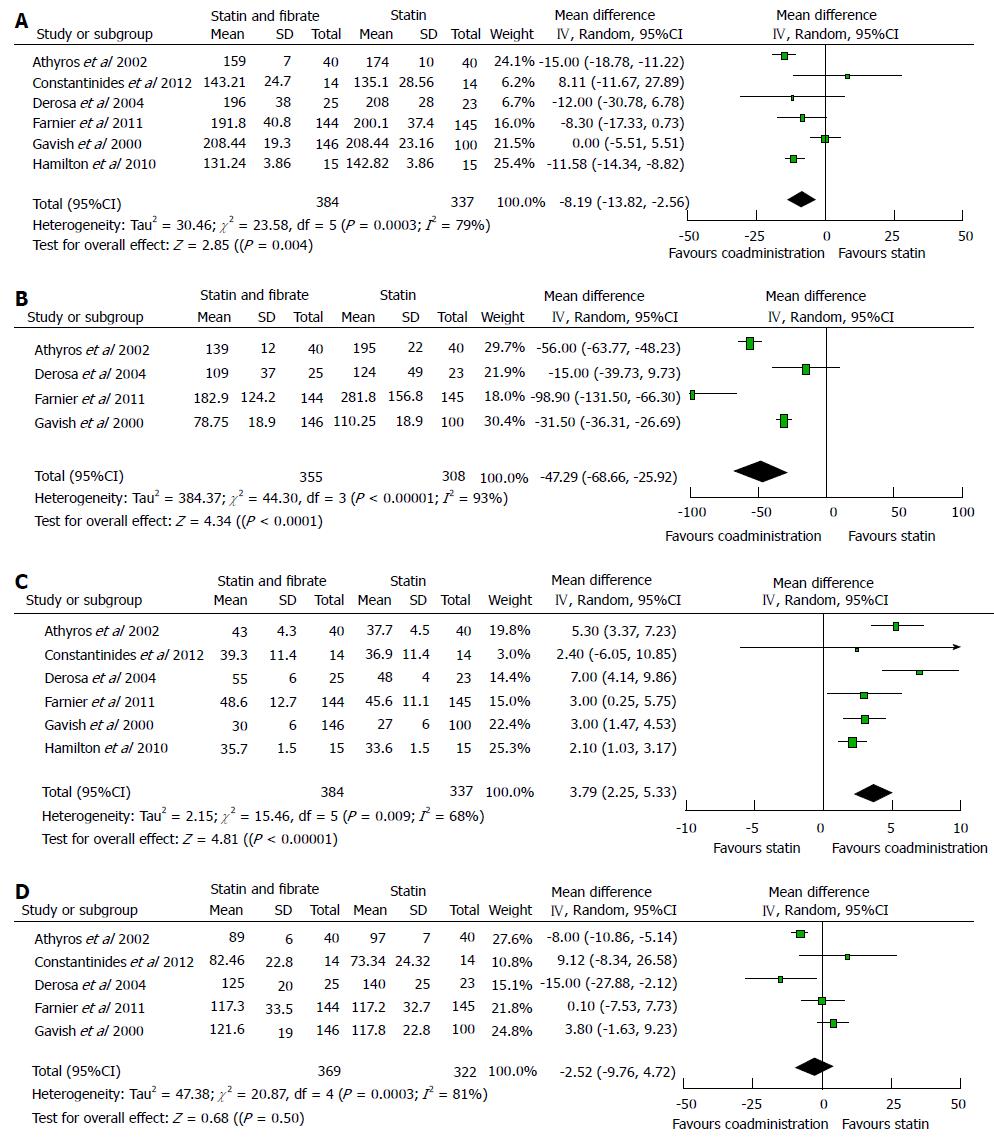
Figure 2 Summary of results of meta-analysis on the lipid modifying function between coadministration of statins and fibrates and statins monotherapy.
A: Comparison of plasma TC concentration between coadministration and statins monotherapy; B: Comparison of plasma TG concentration between coadministration and statins monotherapy; C: Comparison of plasma HDL-C concentration between coadministration and statins monotherapy; D: Comparison of plasma LDL-C concentration between coadministration and statins monotherapy. LDL-C: Low density lipoprotein cholesterol; HDL-C: High density lipoprotein cholesterol; TG: Triglyceride.
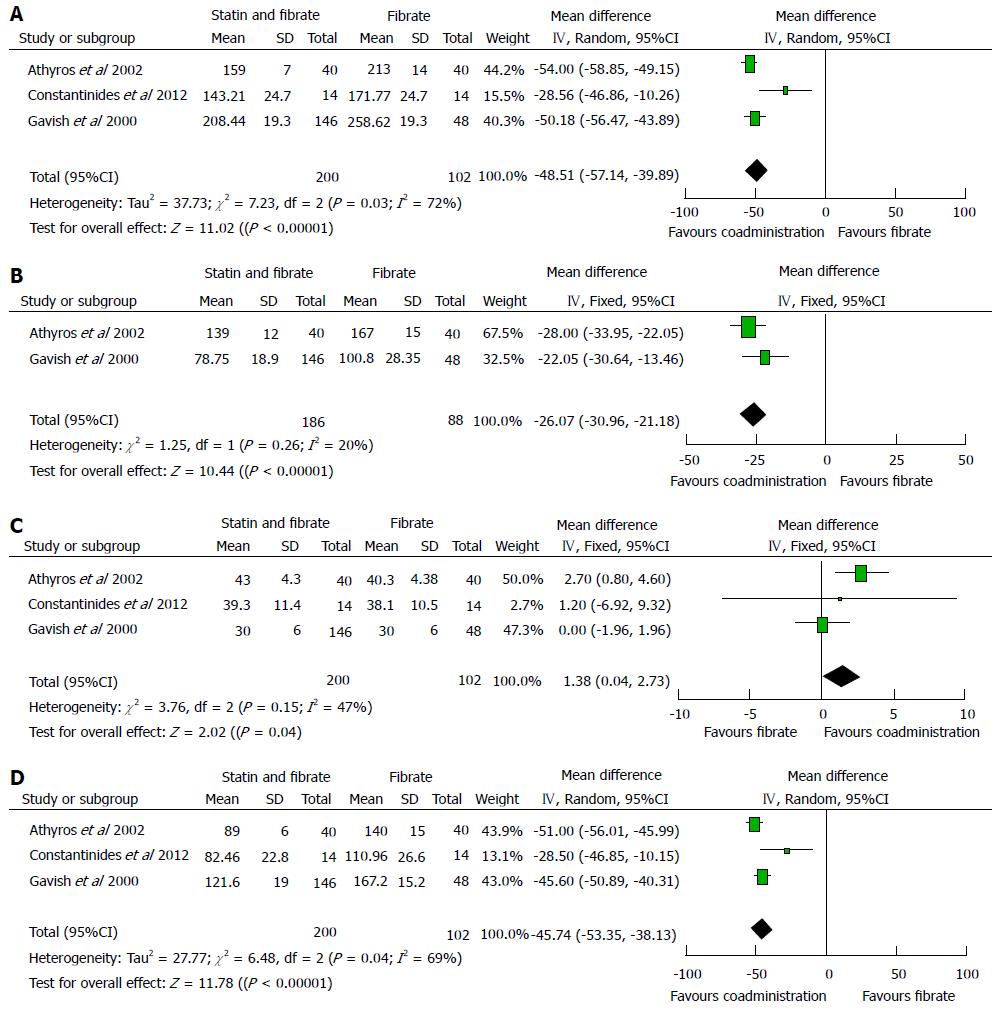
Figure 3 Summary of results of meta-analysis on the lipid modifying function between coadministration of statins and fibrates and fibrates monotherapy.
A: Comparison of plasma TC concentration between coadministration and fibrates monotherapy; B: Comparison of plasma TG concentration between coadministration and fibrates monotherapy; C: Comparison of plasma HDL-C concentration between coadministration and fibrates monotherapy; D: Comparison of plasma LDL-C concentration between coadministration and fibrates monotherapy. LDL-C: Low density lipoprotein cholesterol; HDL-C: High density lipoprotein cholesterol; TG: Triglyceride.
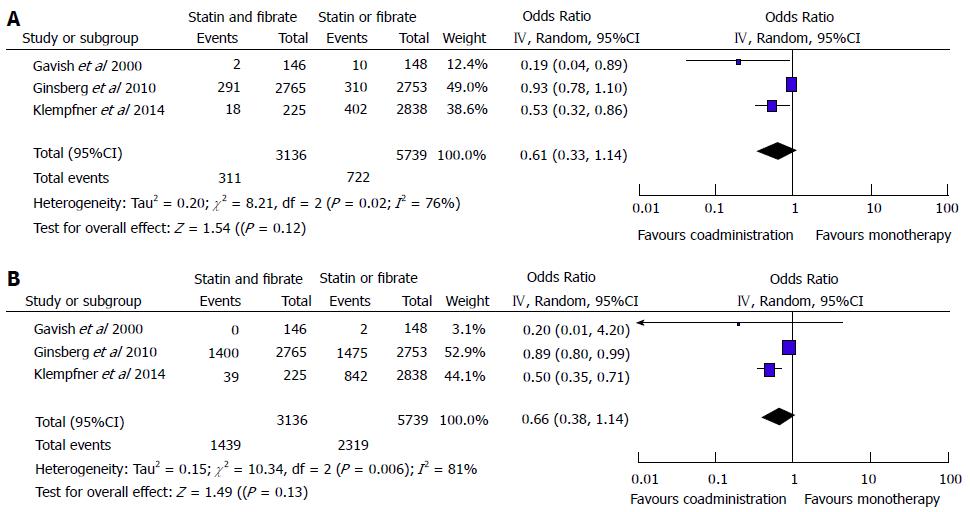
Figure 4 Summary of results of meta-analysis on cardiovascular diseases.
A: Primary clinical endpoints events; B: Secondary clinical endpoints events.
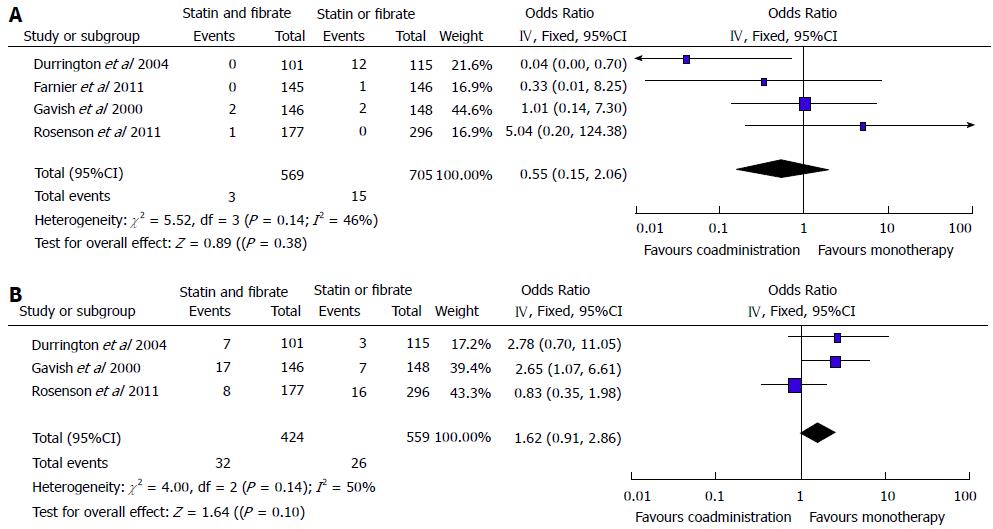
Figure 5 Summary of results of meta-analysis on adverse events.
A: Hepatic-related adverse events; B: Muscular-related adverse events.
- Citation: Zheng S, Li YX, Han TT, Zhang Y, Jiang DD, Hu YM. Systematic review and meta-analysis of Statins-Fibrates therapy in diabetic dyslipidemia patients. World J Meta-Anal 2014; 2(4): 194-203
- URL: https://www.wjgnet.com/2308-3840/full/v2/i4/194.htm
- DOI: https://dx.doi.org/10.13105/wjma.v2.i4.194


