Copyright
©2014 Baishideng Publishing Group Inc.
World J Meta-Anal. Nov 26, 2014; 2(4): 179-185
Published online Nov 26, 2014. doi: 10.13105/wjma.v2.i4.179
Published online Nov 26, 2014. doi: 10.13105/wjma.v2.i4.179
Math 4 Math(A1).
Math 5 Math(A1).
Math 6 Math(A1).
Math 7 Math(A1).
Math 8 Math(A1).
Math 9 Math(A1).
Math 10 Math(A1).
Math 11 Math(A1).
Math 12 Math(A1).
Math 13 Math(A1).
Math 14 Math(A1).
Math 15 Math(A1).
Math 16 Math(A1).
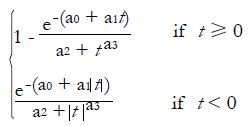
Math 17 Math(A1).
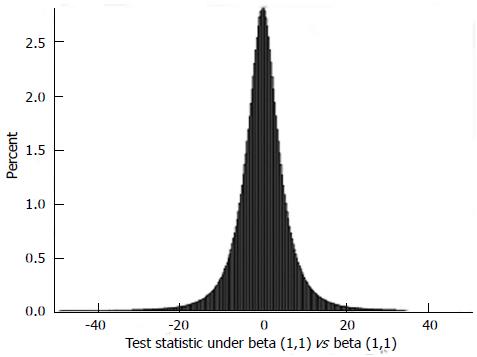
Figure 1 Probability density function of the test statistics for Bivariate meta-analysis under Beta(1,1) vs Beta(1,1) (i.
e., two independent uniform distributions) (n = 5).
Math 18 Math(A1).
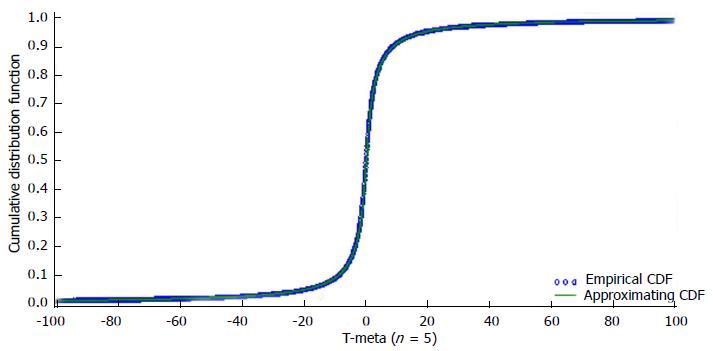
Figure 2 Empirical cumulative distribution function vs approximating cumulative distribution function for Tmeta when n = 5.
CDF: Cumulative distribution function.
Math 19 Math(A1).
Math 20 Math(A1).
Math 21 Math(A1).
Math 22 Math(A1).
Math 23 Math(A1).
Math 24 Math(A1).
Math 25 Math(A1).
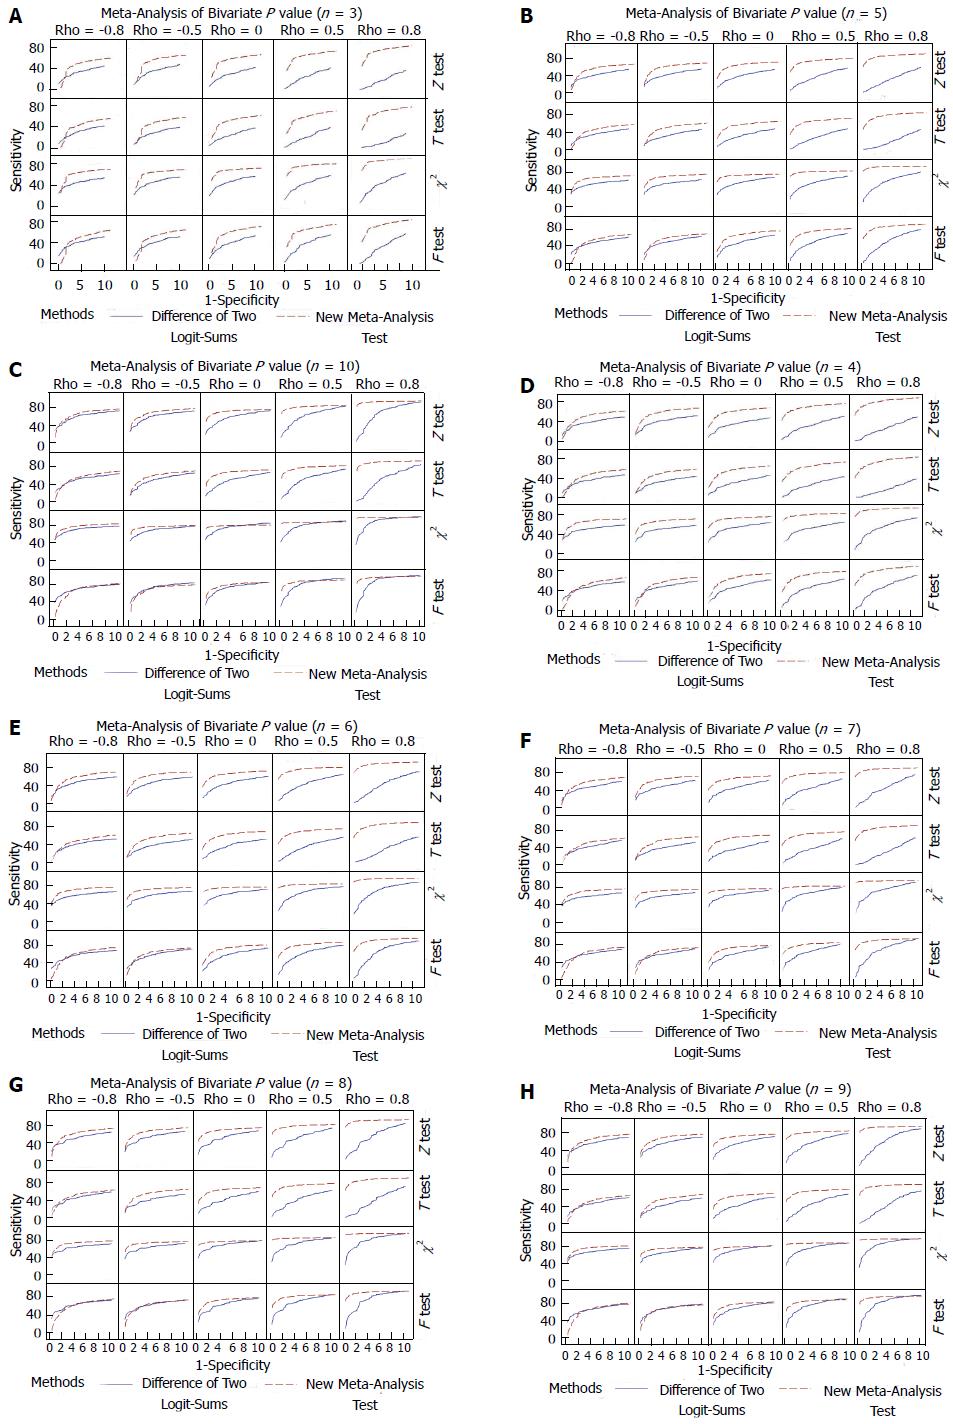
Figure 3 Meta-analysis of Bivariate P values.
A: n = 3; B: n = 5; C: n = 10; D: n = 4; E: n = 6; F: n = 7; G: n = 8; H: n = 9.
-
Citation: Kocak M. Meta-analysis of bivariate
P values. World J Meta-Anal 2014; 2(4): 179-185 - URL: https://www.wjgnet.com/2308-3840/full/v2/i4/179.htm
- DOI: https://dx.doi.org/10.13105/wjma.v2.i4.179


