Copyright
©2014 Baishideng Publishing Group Inc.
World J Meta-Anal. Aug 26, 2014; 2(3): 78-90
Published online Aug 26, 2014. doi: 10.13105/wjma.v2.i3.78
Published online Aug 26, 2014. doi: 10.13105/wjma.v2.i3.78
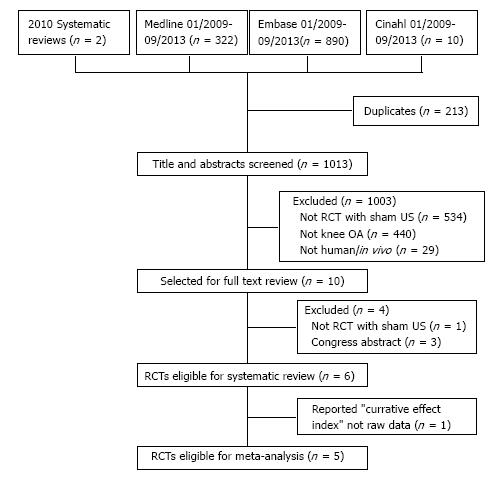
Figure 1 Flow diagram for identification of eligible trials evaluating the effect of ultrasound vs sham on pain and physical function.
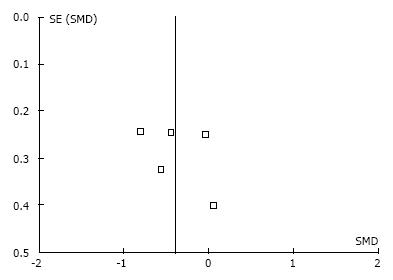
Figure 2 Funnel plot illustrating the statistical precision plotted as a function of the standardized mean difference for the effect of therapeutic ultrasound on patient-reported knee pain.
Statistical inferences are not possible when fewer than 10 trials are available; therefore the pseudo 95% confidence limits around the summary treatment effect are not shown. SMD: Standardized mean difference.
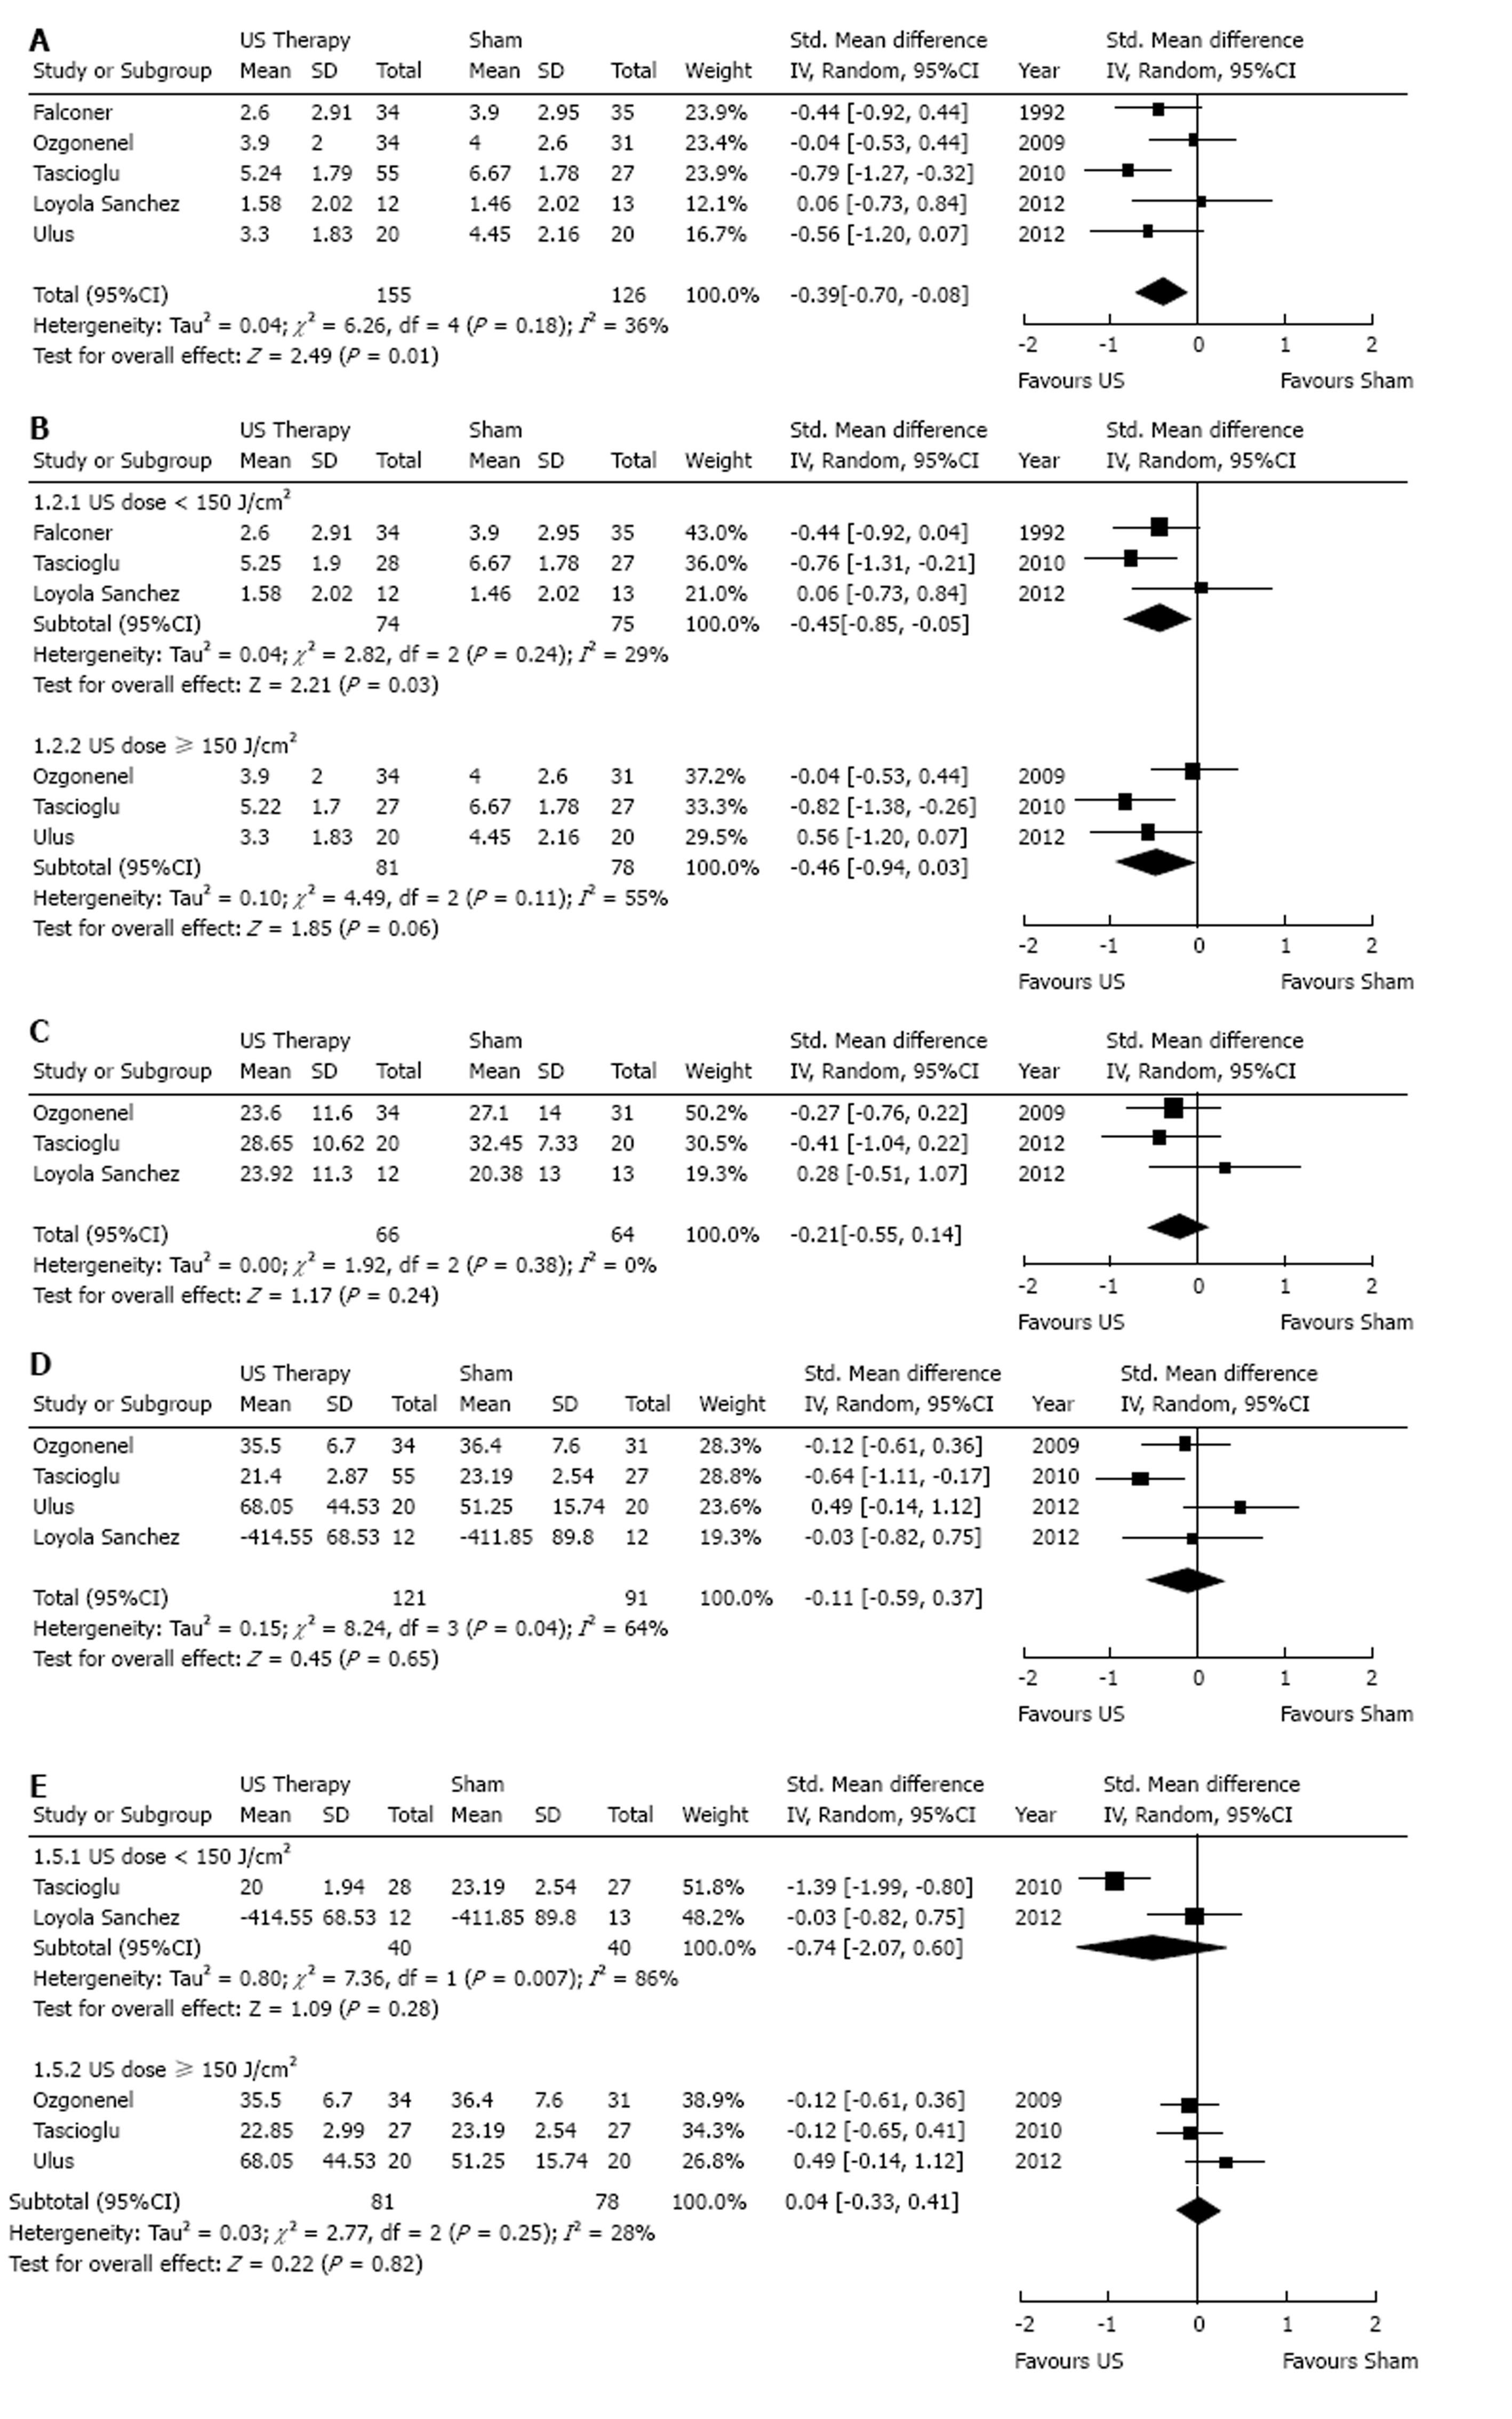
Figure 3 Forest plot.
A: For meta-analysis of the effect of ultrasound (US) compared to sham on pain; B: For trials reporting the pain outcome subgrouped according to US dose; C: For meta-analysis of the effect of US compared to sham treatment on self-reported physical function; D: For meta-analysis of the effect of US compared to sham treatment on walking performance; E: For trials reporting a walking performance outcome subgrouped according to US dose.
- Citation: MacIntyre NJ, Negm A, Loyola-Sánchez A, Bhandari M. Efficacy of therapeutic ultrasound vs sham ultrasound on pain and physical function in people with knee osteoarthritis: A meta-analysis of randomized controlled trials. World J Meta-Anal 2014; 2(3): 78-90
- URL: https://www.wjgnet.com/2308-3840/full/v2/i3/78.htm
- DOI: https://dx.doi.org/10.13105/wjma.v2.i3.78


