Copyright
©2014 Baishideng Publishing Group Inc.
World J Meta-Anal. May 26, 2014; 2(2): 36-41
Published online May 26, 2014. doi: 10.13105/wjma.v2.i2.36
Published online May 26, 2014. doi: 10.13105/wjma.v2.i2.36
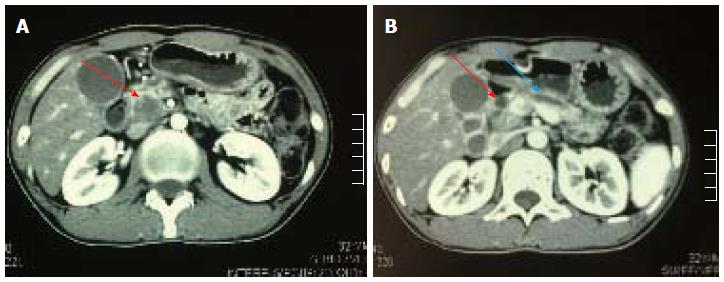
Figure 1 Computed tomography characteristics of a pancreatic melanoma.
A computed tomography scan demonstrating a hypodense mass in the pancreatic head (A) (red arrow) and dilation of the common bile duct and pancreatic duct (B) (red and blue arrow).
Figure 2 HE and IHC staining of pancreatic melanoma tissue.
A: HE section showing a spindle cell appearance with melanin pigment production in a patient with a dilated pancreatic duct (arrow) (HE × 100); B: Immunostaining image showing expression of HMB-45 (× 400); C: Immunostaining image showing expression of S100 (× 200).
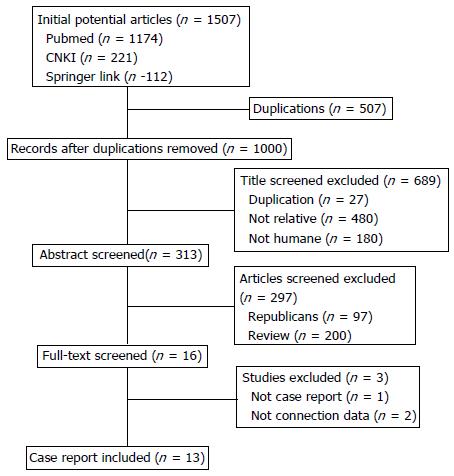
Figure 3 Process of selection of articles.
The process of searching for articles for inclusion in this article: 1507 articles were found and 1000 articles remained after removal of duplicates. After review of the complete texts, 13 articles met the inclusion criteria and were included.
Figure 4 Kaplan Meier survival curves.
The overall median survival was 10 mo.
- Citation: Yuan ZN, Liu FH, Tang Y. Overview and a meta-analysis of pancreatic melanoma based on case reports. World J Meta-Anal 2014; 2(2): 36-41
- URL: https://www.wjgnet.com/2308-3840/full/v2/i2/36.htm
- DOI: https://dx.doi.org/10.13105/wjma.v2.i2.36


