Copyright
©The Author(s) 2022.
World J Meta-Anal. Jun 28, 2022; 10(3): 162-176
Published online Jun 28, 2022. doi: 10.13105/wjma.v10.i3.162
Published online Jun 28, 2022. doi: 10.13105/wjma.v10.i3.162
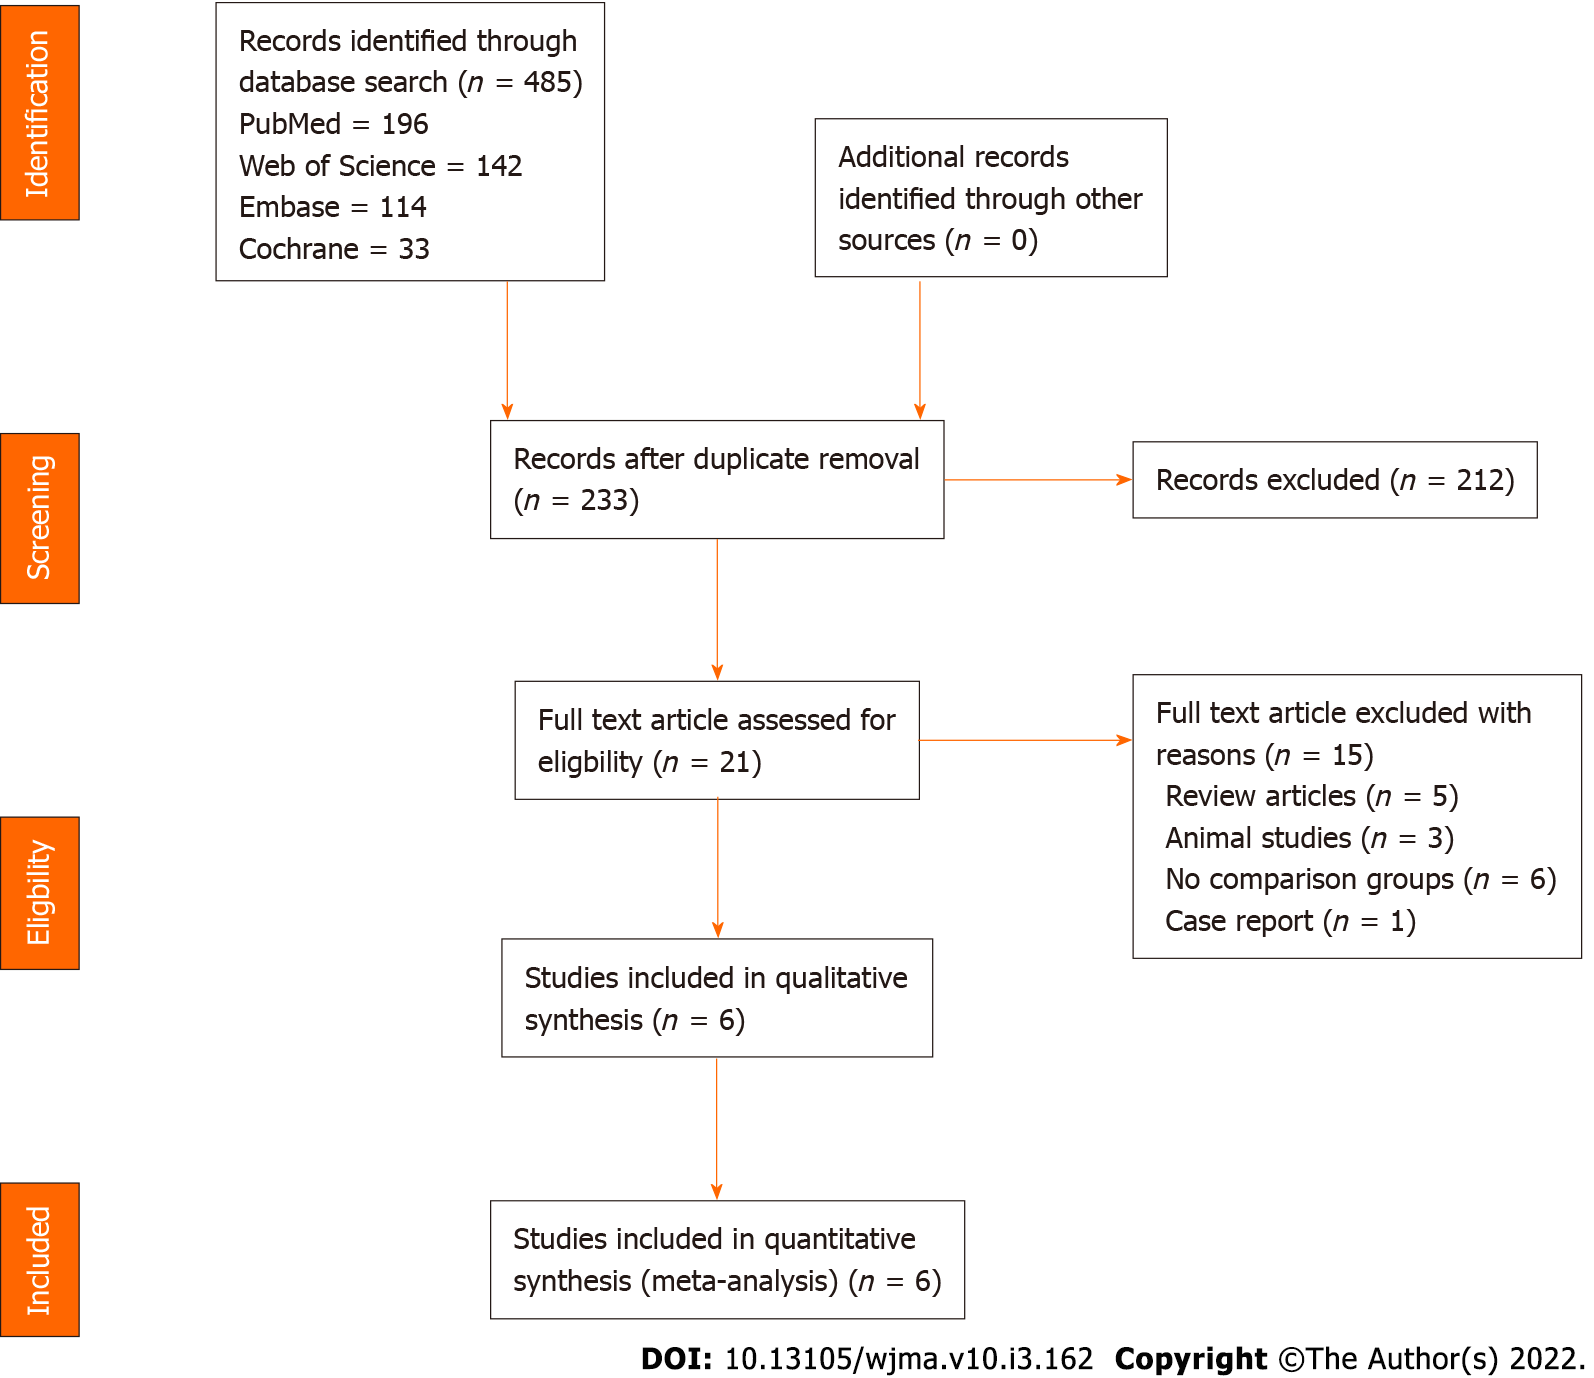
Figure 1
PRISMA flow diagram of the included studies.
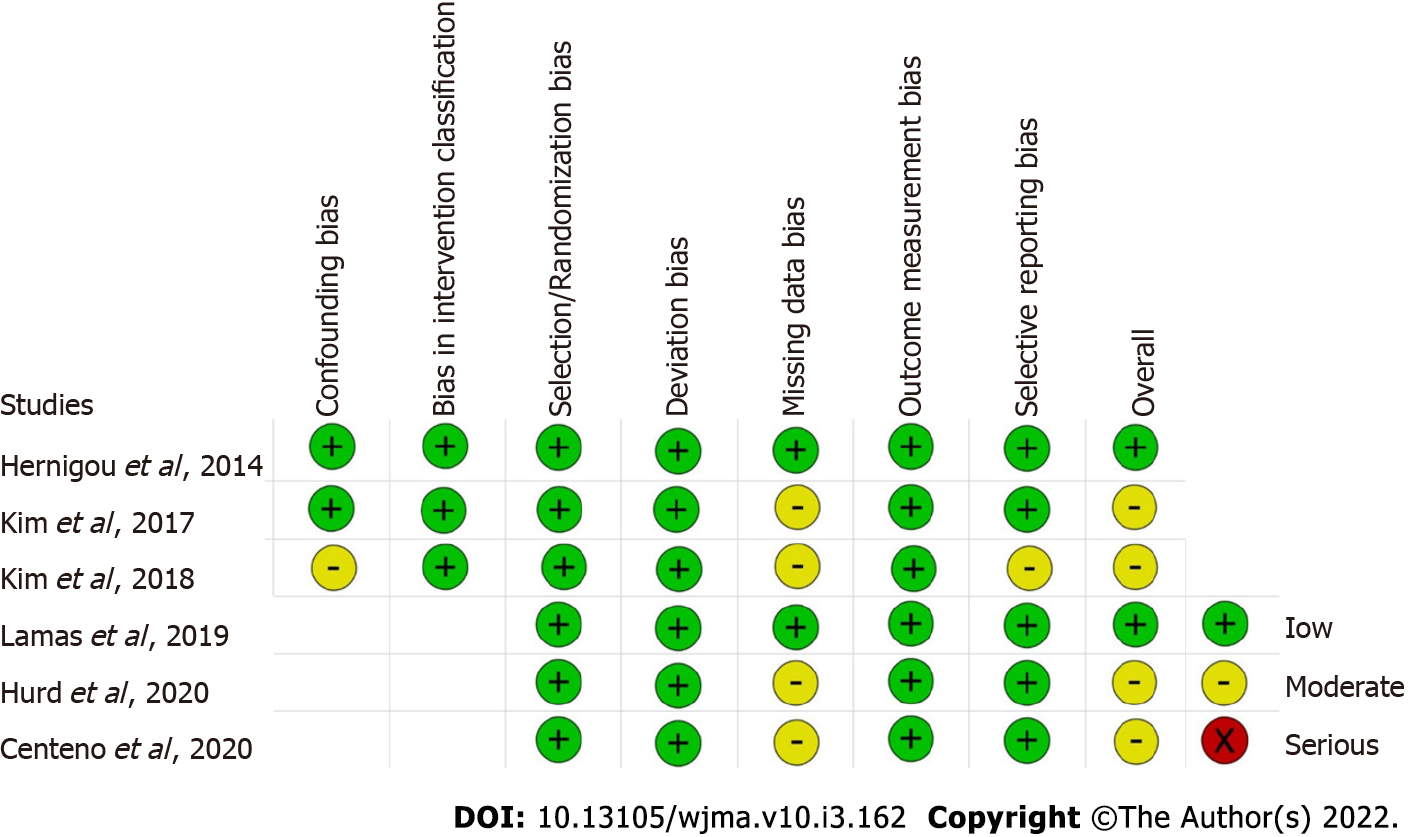
Figure 2
Methodological quality and risk of bias assessment of all the included studies.
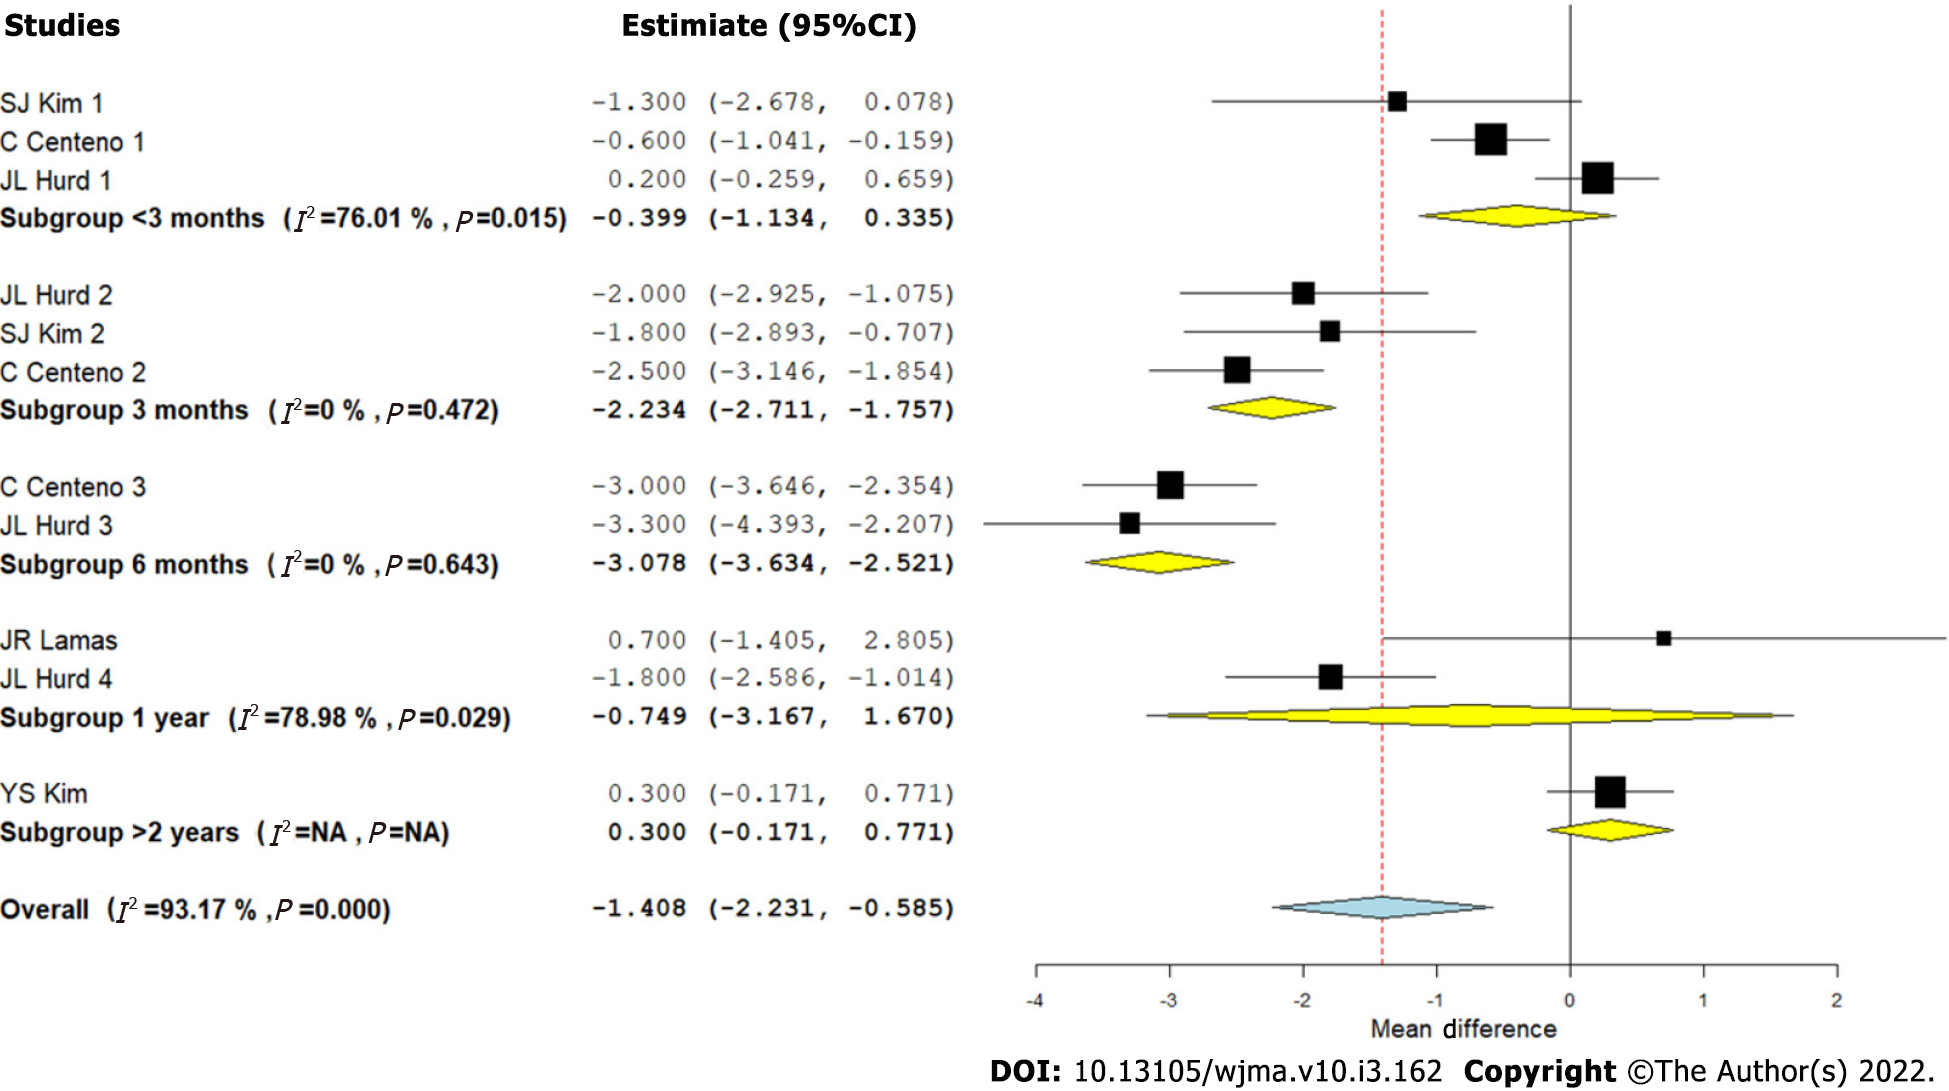
Figure 3
Forest plot of the included studies analyzing the Visual Analog Scale score outcomes at varied time points compared to their controls.
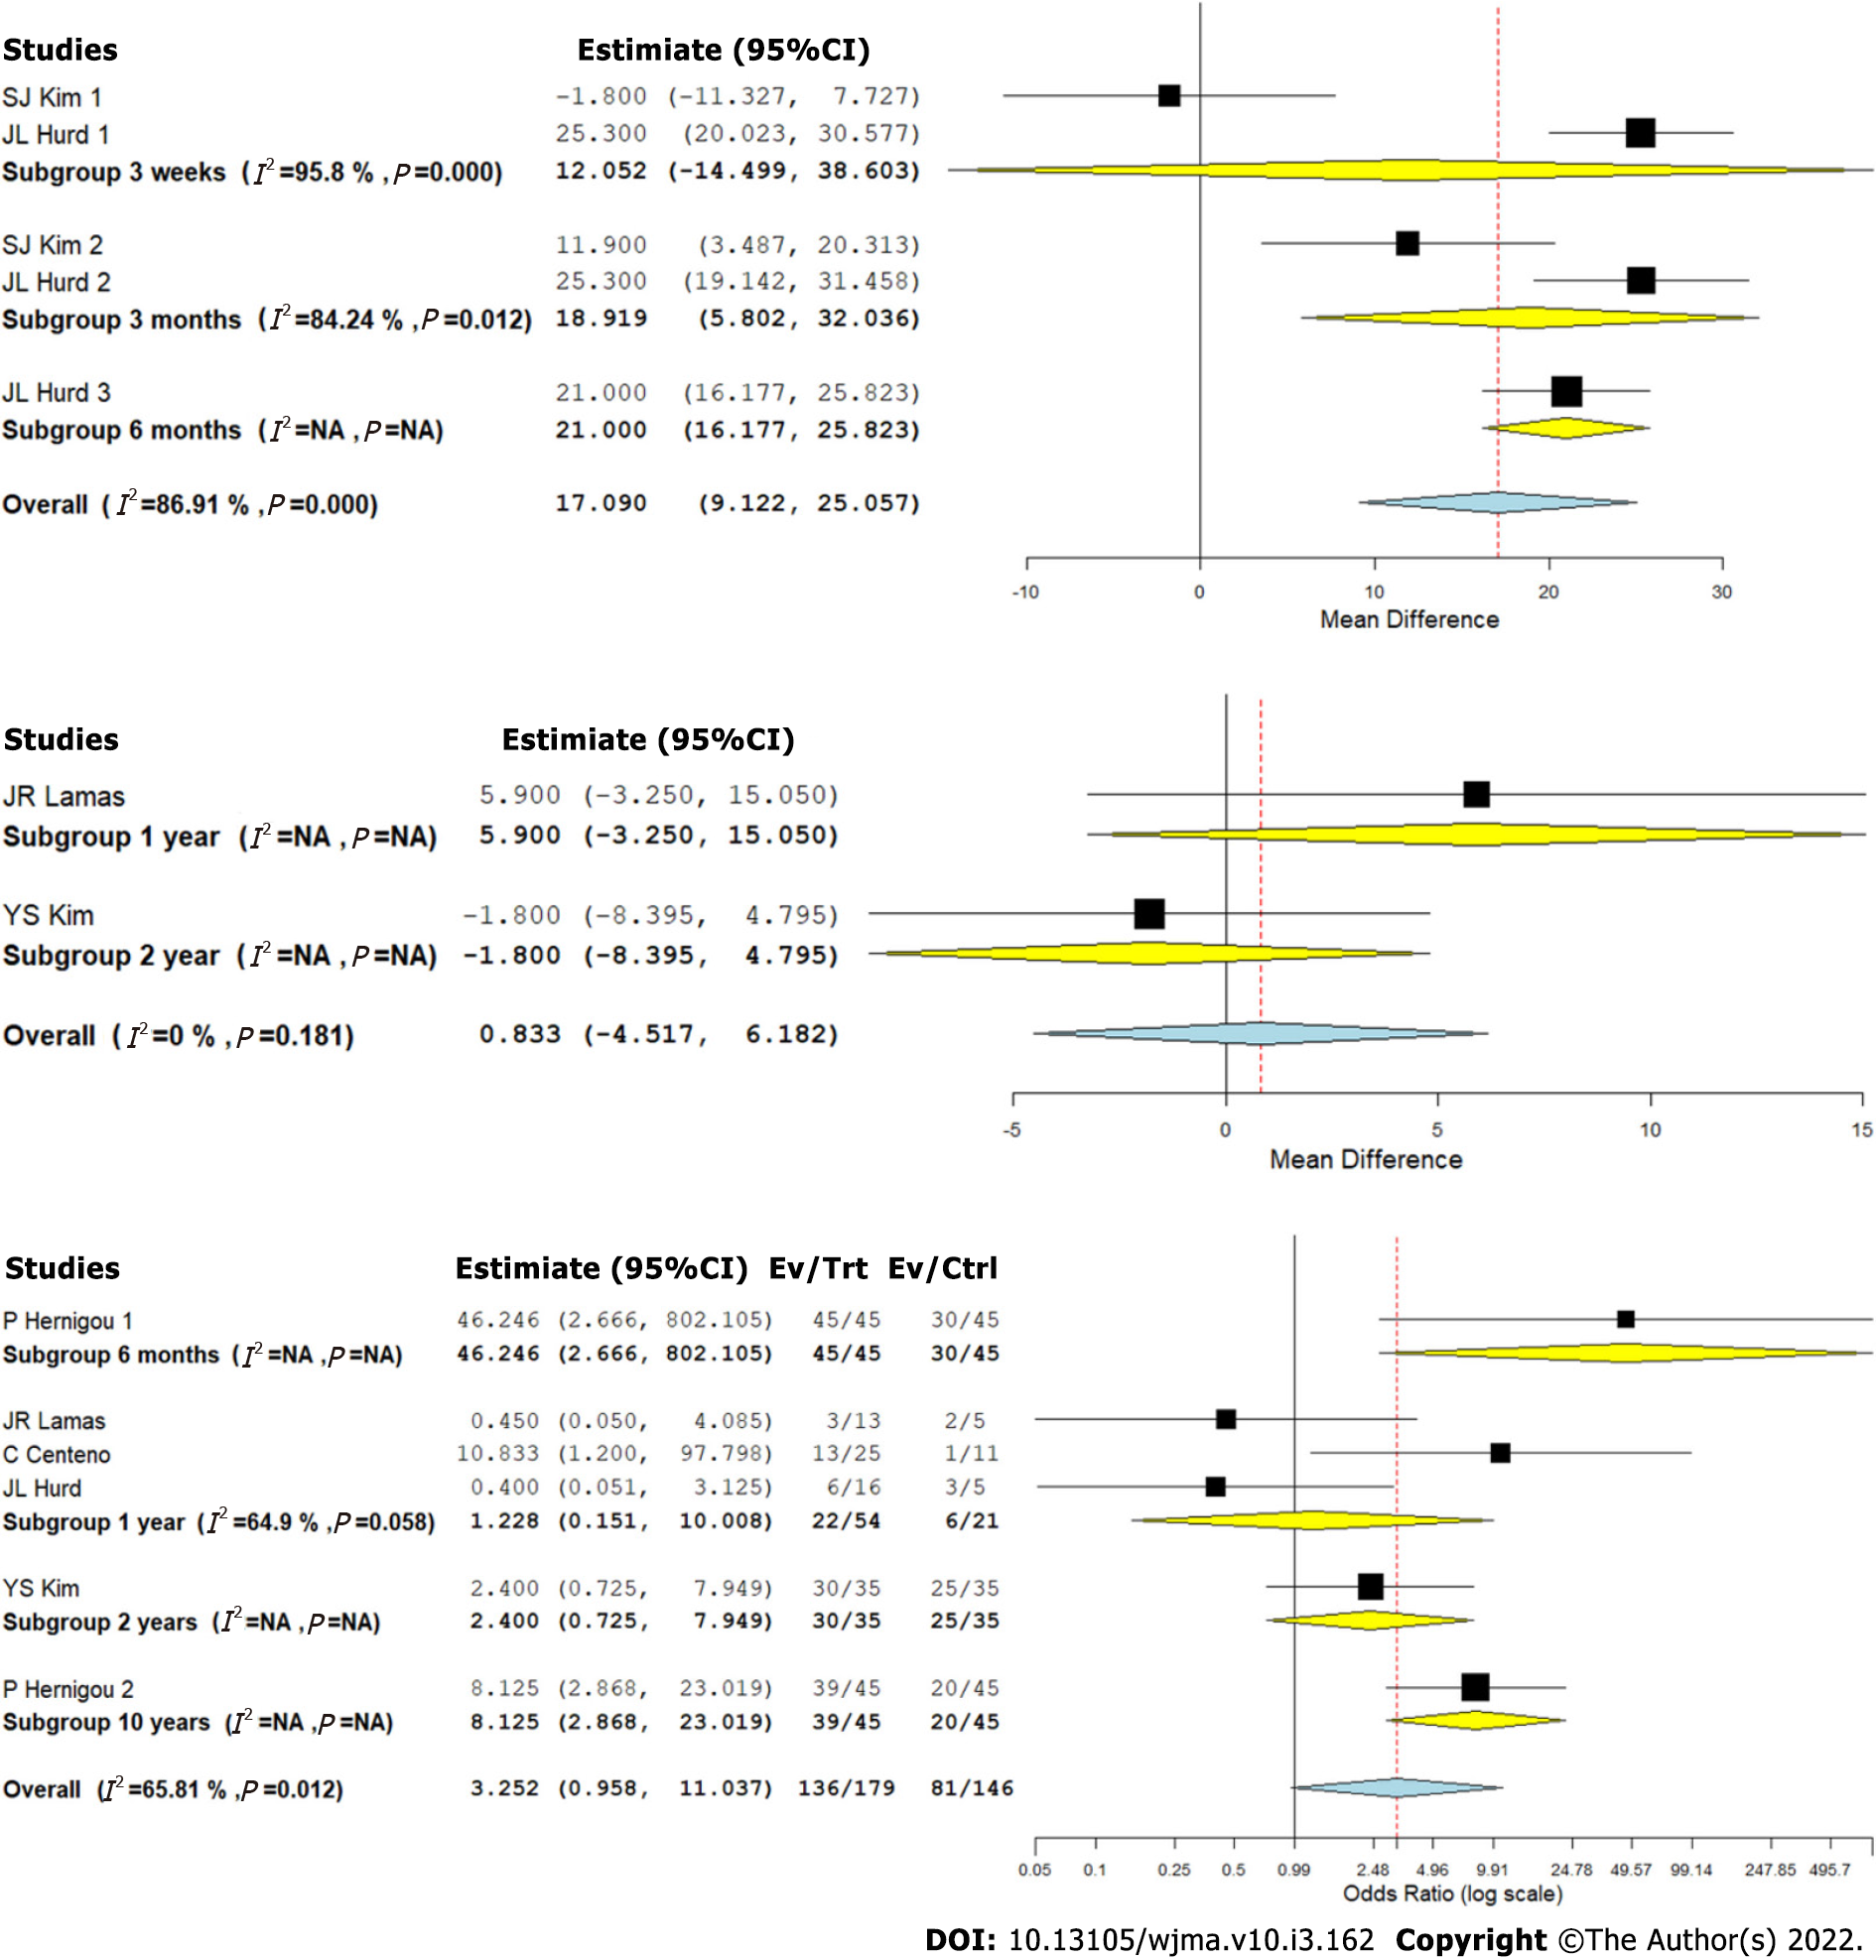
Figure 4 Forest plot of the included studies analyzing the functional outcomes at varied time points compared to their controls.
A: American Shoulder and Elbow Surgeons score; B: Constant score; C: Magnetic resonance imaging -based healing of rotator cuff tear.
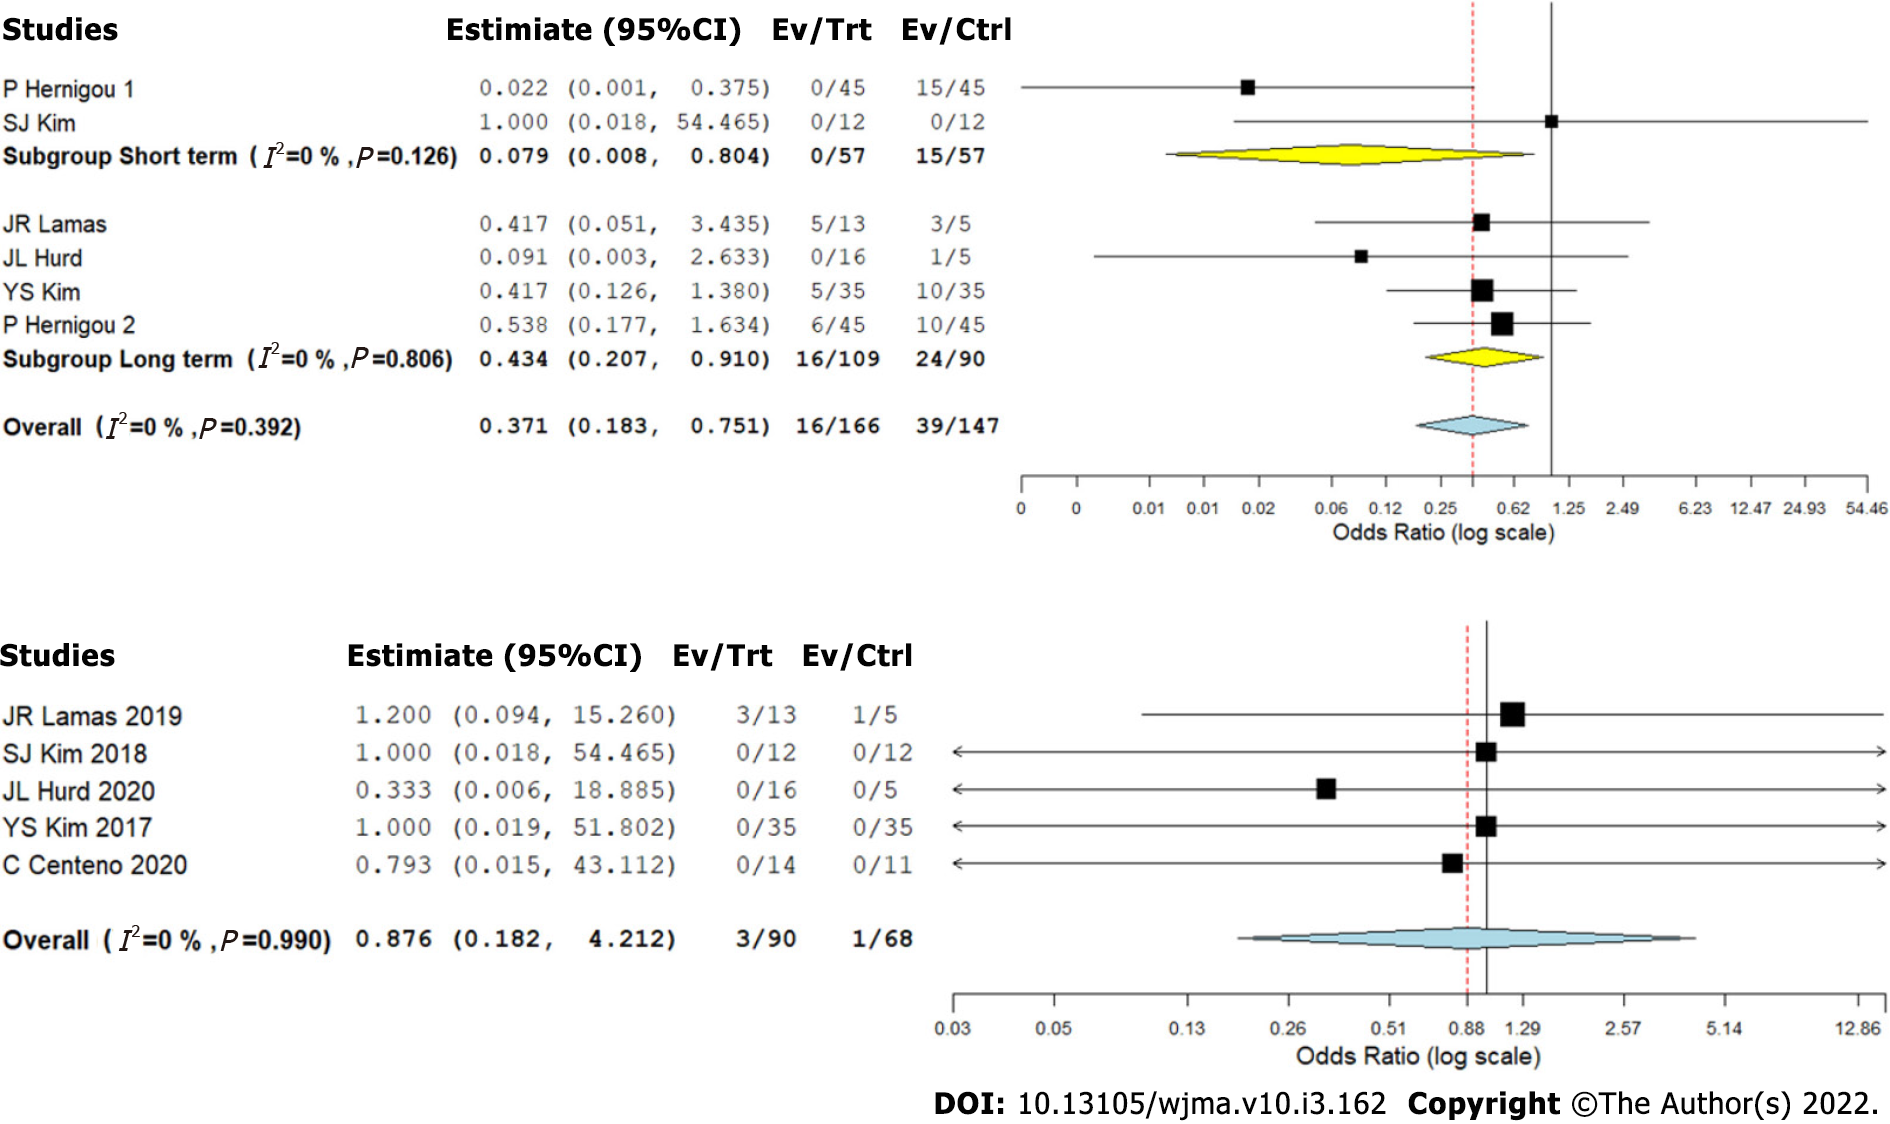
Figure 5 Forest plot of the included studies analyzing the complications at varied time points compared to their controls.
A: Retear rate; B: Adverse events.
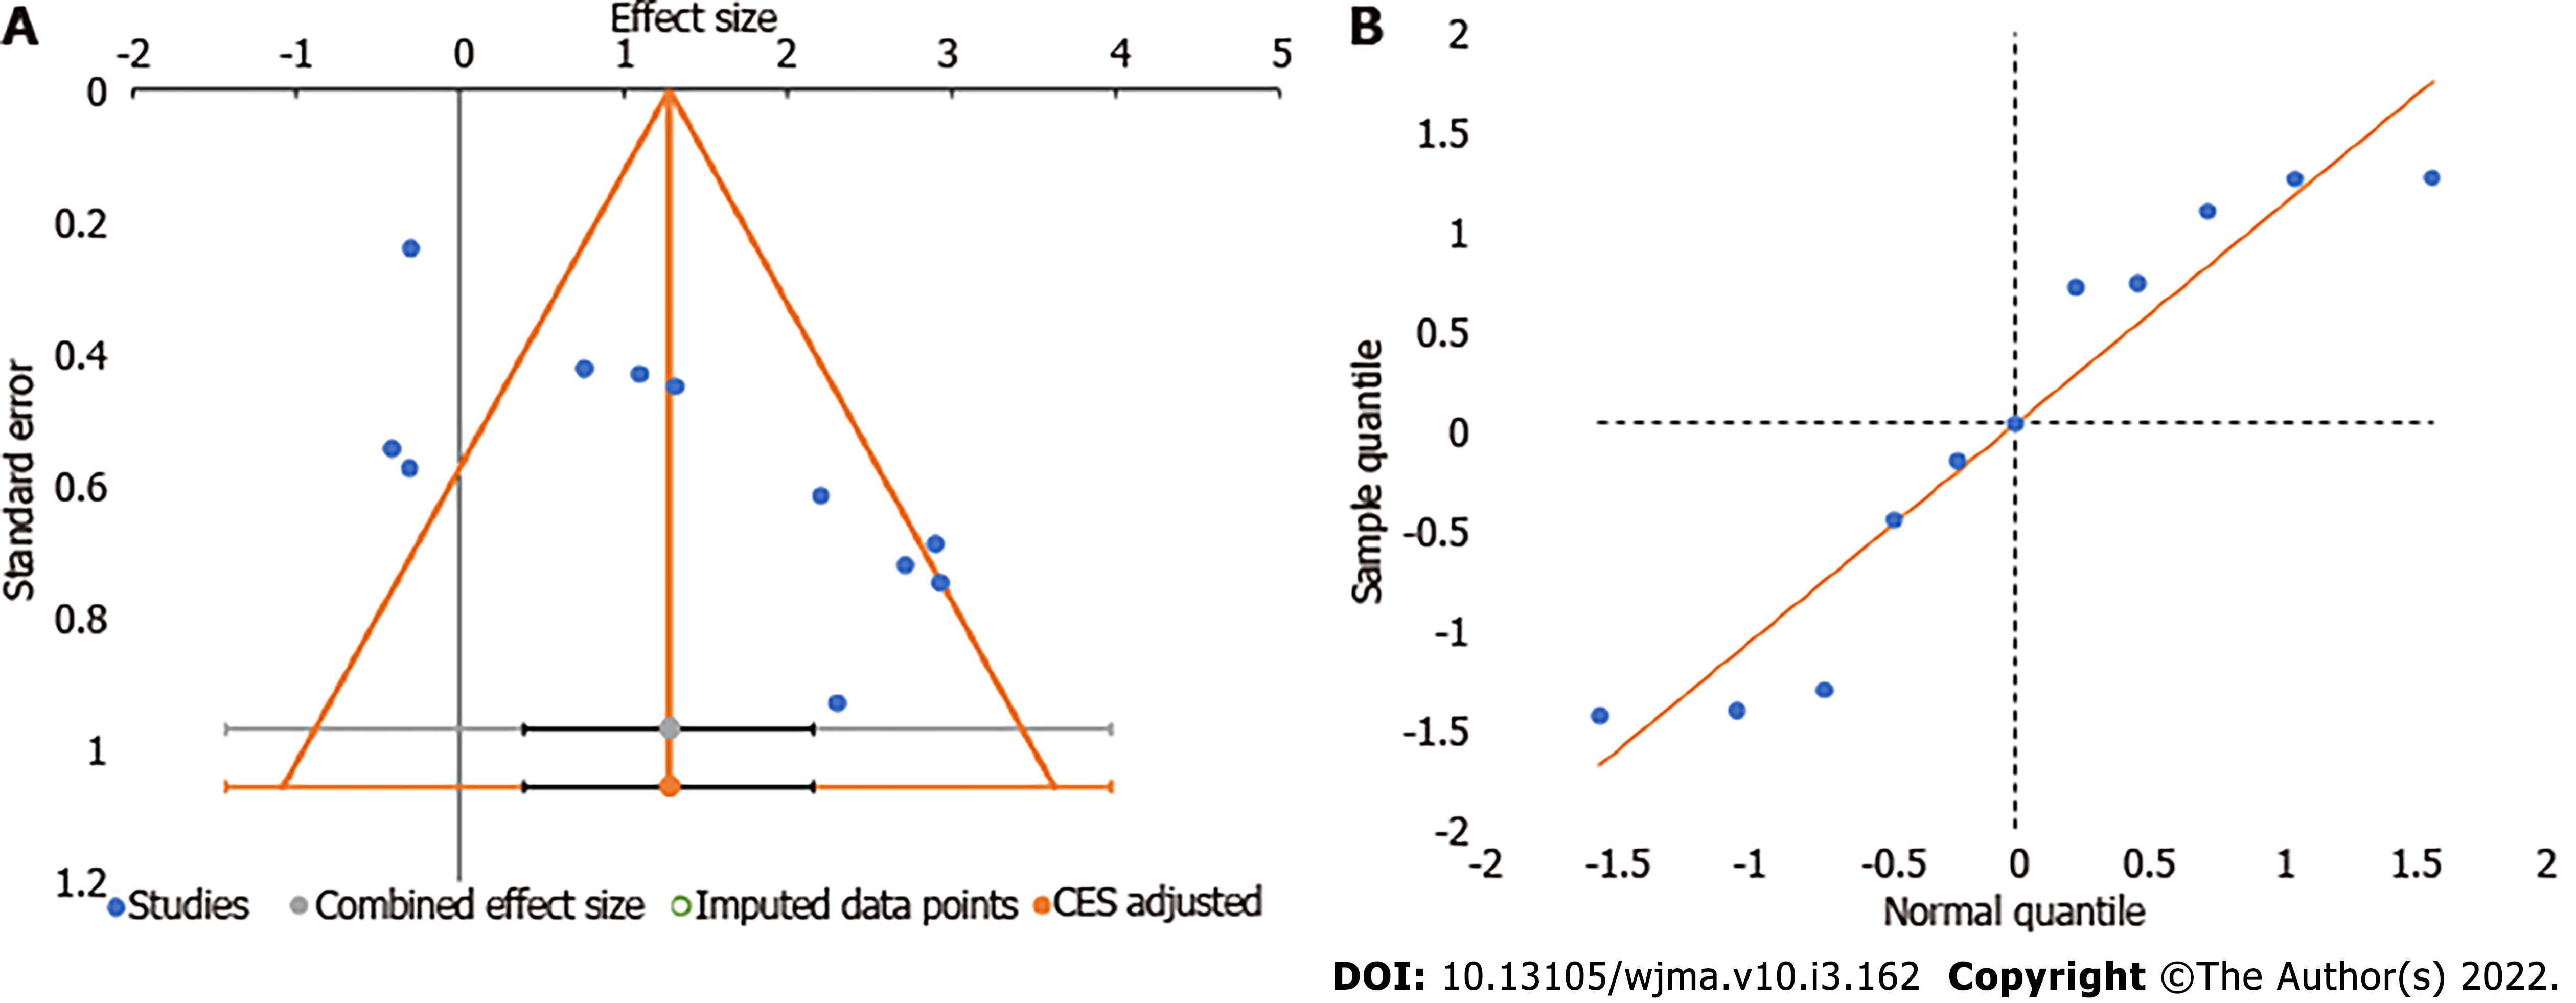
Figure 6
Publication bias assessment with funnel plot and quantile plot for Visual Analog Scale score in the included studies.
- Citation: Muthu S, Mogulesh C, Viswanathan VK, Jeyaraman N, Pai SN, Jeyaraman M, Khanna M. Is cellular therapy beneficial in management of rotator cuff tears? Meta-analysis of comparative clinical studies. World J Meta-Anal 2022; 10(3): 162-176
- URL: https://www.wjgnet.com/2308-3840/full/v10/i3/162.htm
- DOI: https://dx.doi.org/10.13105/wjma.v10.i3.162


